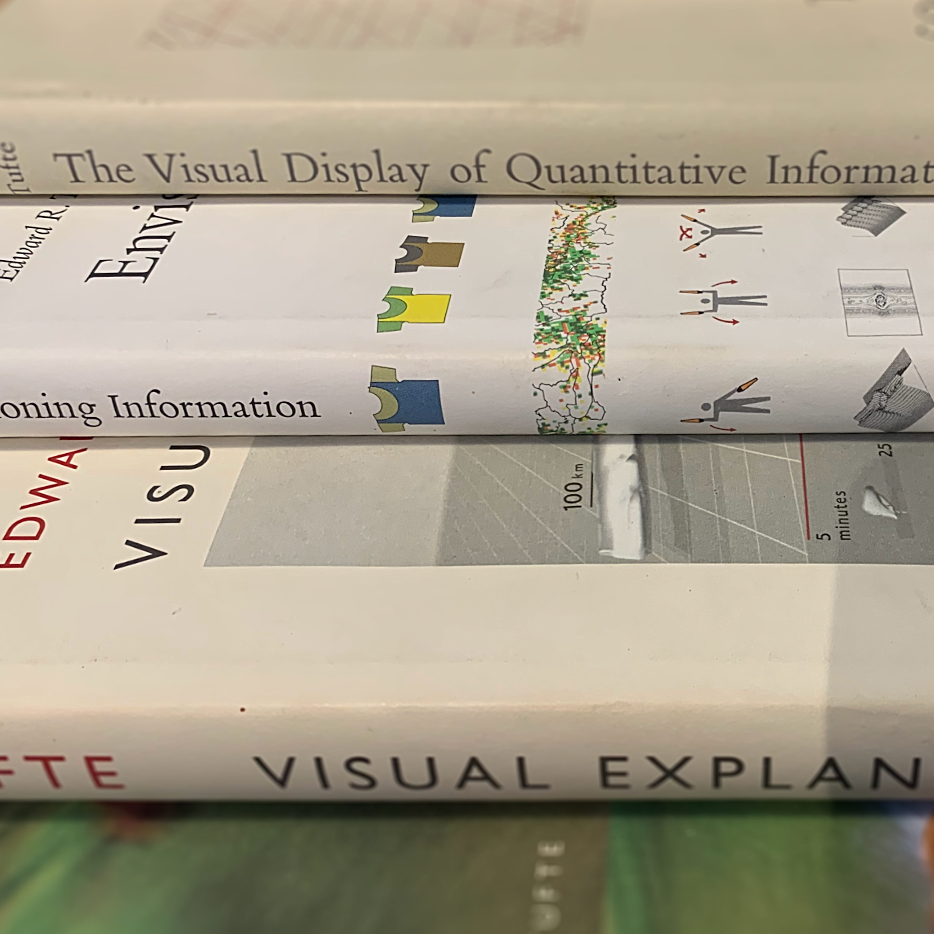
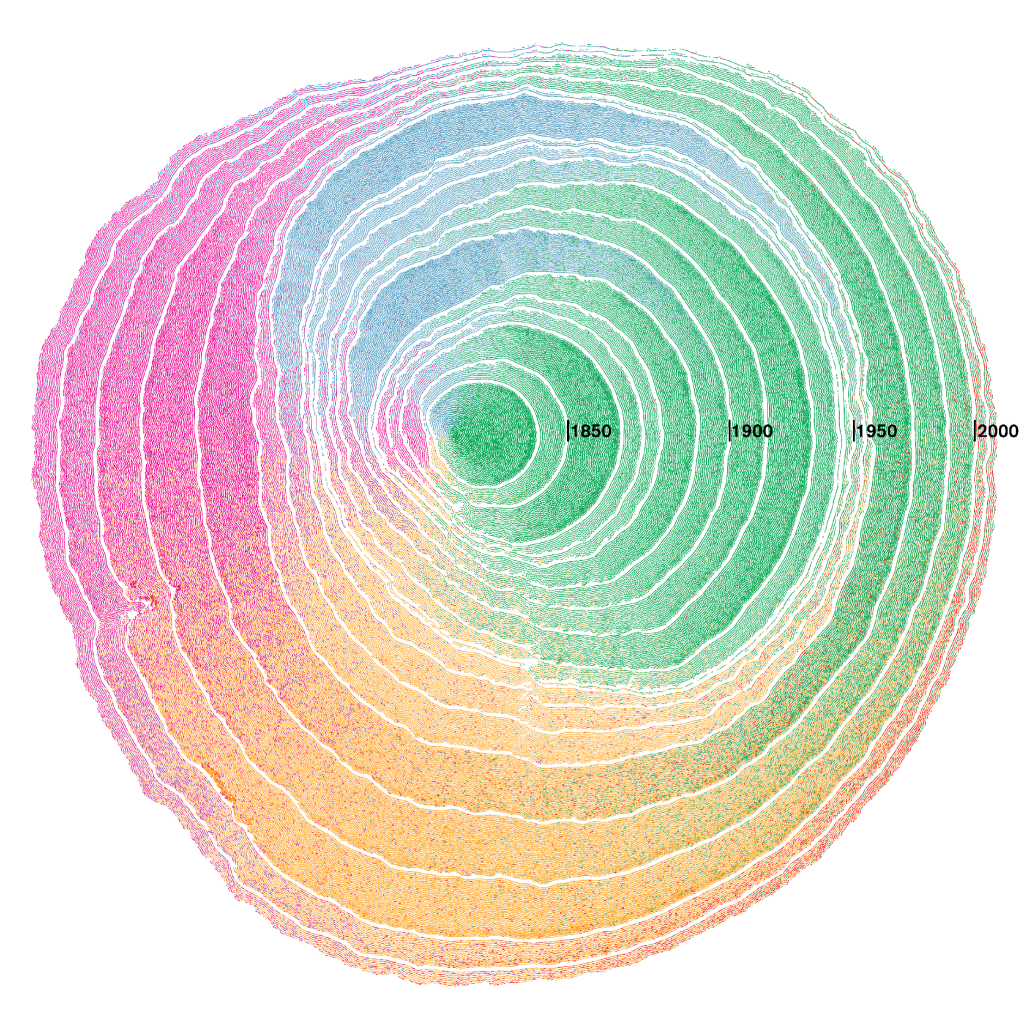
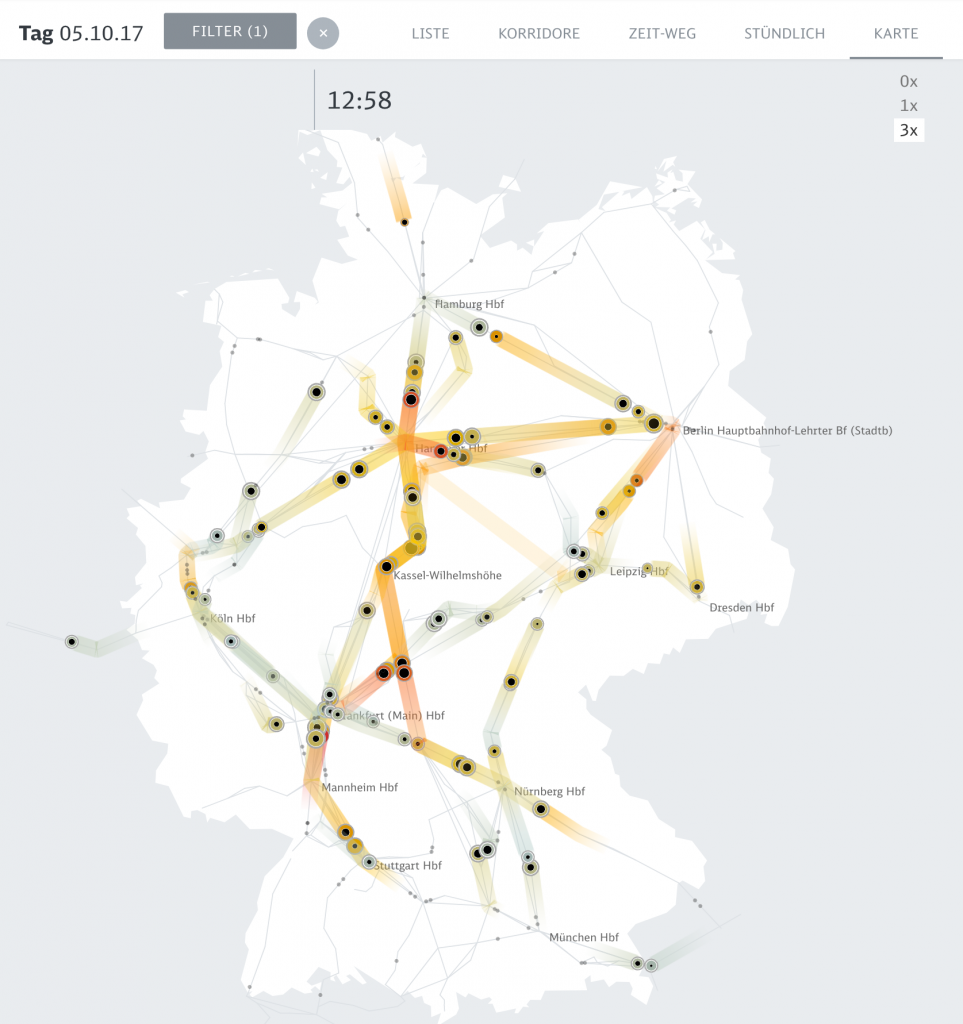
Skip to content
  • Twitter
  • Email
  • RSS
Data Stories

Data Stories

A podcast on data visualization with Enrico Bertini and Moritz Stefaner
Menu
  • Home
  • News
  • Team
  • Transcripts
  • Episodes

165  |  Data Visualization Accessibility with Sarah Fossheim

164  |  Edward Tufte's complete work with Sandra Rendgen

163  |  svelte.js for web-based dataviz with Amelia Wattenberger

162  |  Highlights from IEEE VIS'20 with Miriah Meyer and Danielle Szafir

161  |  People of the Pandemic with Shirley Wu

160  |  Visualizing COVID-19 with Carl Bergstrom

159  |  Viz Agencies: Dataveyes and Accurat

158  |  Viz Agencies: CLEVER°FRANKE and Interactive Things

157  |  Spatial Thinking with Barbara Tversky

156  |  Visualizing Fairness in Machine Learning with Yongsu Ahn and Alex Cabrera

155  |  Flourish with Duncan Clark

154  |  Visualizing Global Warming with IPCC with Angela Morelli and Tom Gabriel Johansen

153  |  Data Art and Visual Programming with Marcin Ignac from Variable

152  |  Year in Review 2019

151  |  Future Data Interfaces with David Sheldon-Hicks

150  |  Highlights from IEEE VIS'19 with Tamara Munzner and Robert Kosara

149  |  xkcd or the art of data storytelling with web cartoons

148  |  Cognitive Science for Data Visualization with Lace Padilla

147  |  Iconic Climate Visuals with Ed Hawkins

146  |  Sweating the details with Nicholas Rougeux

145  |  FT Data Crunch with Federica Cocco and John Burn-Murdoch

144  |  History of Information Graphics with Sandra Rendgen

143  |  The Pudding with Matt Daniels

142  |  Data Is Personal with Evan Peck

141  |  Sketching and Visual Thinking with Eva-Lotta Lamm

140  |  Data Visualization Society

139  |  Immersive Analytics with Tim Dwyer

138  |  Turning Data into Sound with Hannah Davis

137  |  Visualizing Earth with Cameron Beccario

136  |  Simulated Dendrochronology of U.S. Immigration with Pedro Cruz and John Wihbey

135  |  The "Dashboard Conspiracy" with Lyn Bartram and Alper Sarikaya

134  |  Visualizing Uncertainty with Jessica Hullman and Matthew Kay

133  |  Year Review 2018

132  |  A New Generation of DataViz Tools

131  |  Peak Spotting

130  |  Highlights from IEEE VIS 2018

129  |  Views of the World with Robert Simmon

128  |  Visual Perception and Visualization with Steve Haroz

127  |  Storytelling with Data with Cole Nussbaumer Knaflic

126  |  FlowingData with Nathan Yau

125  |  Researching the Boundaries of InfoVis with Sheelagh Carpendale

124  |  Xenographics with Maarten Lambrechts

123  |  Touch Graphics with Steve Landau

122  |  Visualizing Climate Change Scenarios with Boris Müller

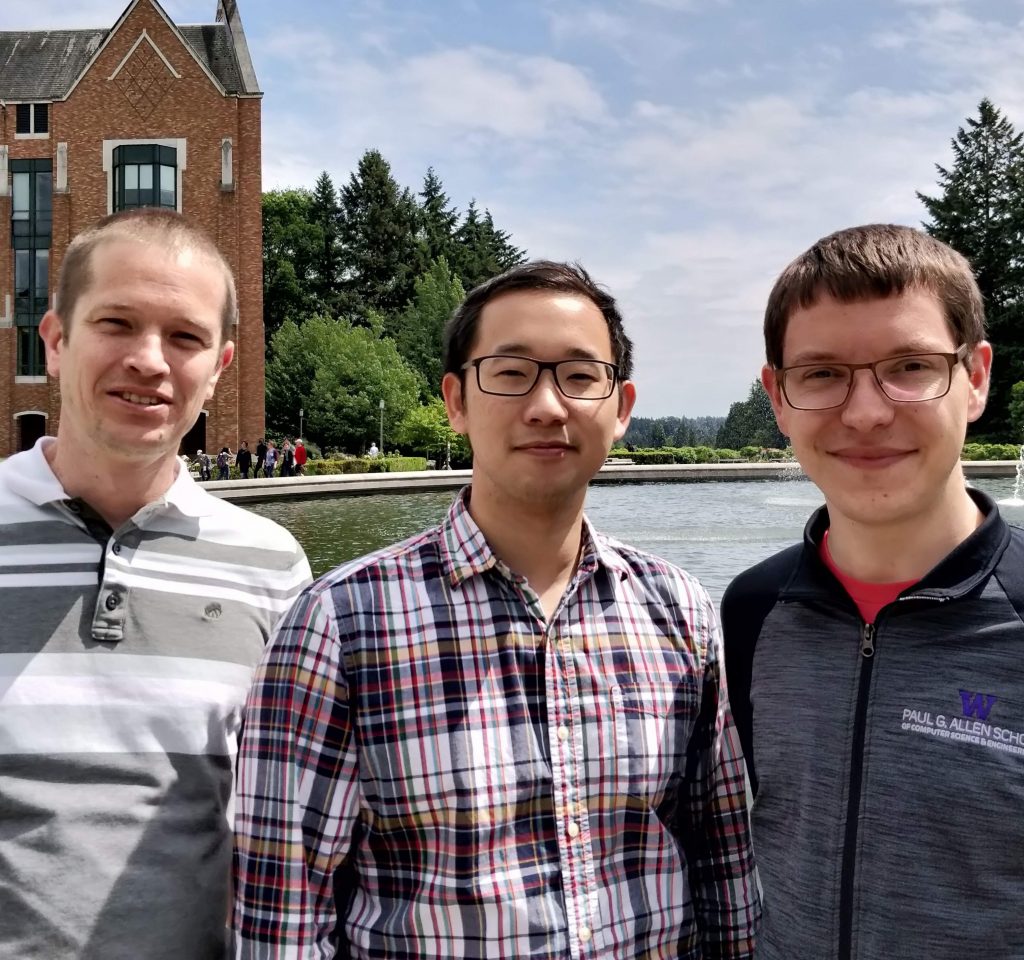
121  |  Declarative Visualization with Vega-Lite and Altair with Dominik Moritz, Jacob Vanderplas, Kanit “Ham” Wongsuphasawat

120  |  Data Science and Visualization with David Robinson

119  |  Color with Karen Schloss

118  |  Making Data Visual with Miriah Meyer and Danyel Fisher

117  |  Datawrapper with Lisa C. Rost and Gregor Aisch

116  |  Cognitive Bias and Visualization with Evanthia Dimara

115  |  Human-Driven Machine Learning with Saleema Amershi

114  |  Machine Learning for Artists with Gene Kogan

113  |  What Makes A Visualization Memorable? with Michelle Borkin

112  |  Data Pottery with Alice Thudt

111  |  Data Vis Around The World in 2017

110  |  What's Going On In This Graph? with Michael Gonchar and Sharon Hessney

109  |  Feminist Data Visualization with Catherine D’Ignazio

108  |  Review of IEEE VIS’17 with Jessica Hullman and Robert Kosara

107  |  Visualizing Bitcoin with Dan McGinn

106  |  Data Sculptures with Adrien Segal

105  |  Data Visualization at Twitter with Krist Wongsuphasawat

104  |  Visualization Literacy in Elementary School with Basak Alper and Nathalie Riche

103  |  Explorable Explanations with Nicky Case

102  |  Understanding Comics and Visual Storytelling with Scott McCloud

101  |  Surprise Maps with Michael Correll and Jeff Heer

100  |  Data Stories 100!!!

099  |  Data Visualization at Capital One with Kim Rees and Steph Hay

098  |  Data Sketches with Nadieh Bremer and Shirley Wu

097  |  Calling Bullshit with Carl Bergstrom and Jevin West

096  |  Innovation from Research with Jarke Van Wijk

095  |  Challenges of Being a Vis Professional in Industry with Elijah Meeks

094  |  Uncertainty and Trumpery with Alberto Cairo

093  |  OddityViz with Valentina D’Efilippo and Miriam Quick

092  |  A Tribute to Hans Rosling

091  |  Visualizing Data with RAW

090  |  Beyond the Chart with Brendan Dawes

089  |  Data Vis Around the World in 2016

088  |  Re-designing Visualizations on #MakeoverMonday with Andy Kriebel and Andy Cotgreave

087  |  VizKidz: Books on Data Visualization for Kids

086  |  Highlights from IEEE VIS'16 with Jessica Hullman and Robert Kosara

085  |  Machine Bias with Jeff Larson

084  |  Statistical Numbing with Paul Slovic

083  |  Olympic Feathers with Nadieh Bremer

082  |  Information+ Conference Review

081  |  The Hustle with Mahir Yavuz and Jan Willem Tulp

080  |  Indexical Visualization with Dietmar Offenhuber

079  |  Information Design with Isabel Meirelles

078  |  Mimi Onuoha on Visualizing People's Lives through Mobile Data

077  |  Polygraph and The Journalist Engineer Matt Daniels

076  |  Bocoup and OpenVis Conference

075  |  Listening to Data From Space with Scott Hughes

074  |  Data Ethics and Privacy with Eleanor Saitta

073  |  Kim Albrecht on Untangling Tennis and the Cosmic Web

072  |  Jeff Heer on Merging Industry and Research with the Interactive Data Lab

071  |  Tapestry Conference Review with Robert Kosara

070  |  Rocket Science with Rachel Binx

069  |  Data Visualization Literacy with Jeremy Boy, Helen Kennedy and Andy Kirk

068  |  Poemage: Data Visualization for Poets with Miriah Meyer and Nina McCurdy

067  |  ggplot2, R, and data toolmaking with Hadley Wickham

066  |  "I Quant NY" Finding Surprising Stories in NYC Open Data with Ben Wellington

065  |  What Happened in Vis in 2015? Year Review with Andy Kirk and Robert Kosara

064  |  "Dear Data" with Giorgia Lupi and Stefanie Posavec

063  |  IEEE VIS’15 Recap with Robert Kosara and Johanna Fulda

062  |  Text Visualization: Past, Present and Future with Chris Collins

061  |  Visualizing Your "Google Search History" with Lisa Charlotte Rost

060  |  Upcoming DS Events and Some of Our Recent Projects

059  |  Behind the Scenes of "What's Really Warming The World?" with the Bloomberg Team

058  |  Data Installations w/ Domestic Data Streamers

057  |  Visualizing Human Development w/ Max Roser

056  |  Amanda Cox on Working With R, NYT Projects, Favorite Data

055  |  Disinformation Visualization w/ Mushon Zer-Aviv

054  |  Designing Exploratory Data Visualization Tools w/ Miriah Meyer

000  |  Data Stories tv#00 — The NYT 3D Yield Curve Chart w/ Gregor Aisch

053  |  Data Safaris w/ Benedikt Groß

052  |  Science Communication at SciAm w/ Jen Christiansen

051  |  Smart Cities w/ Dietmar Offenhuber

050  |  Happy Birthday Data Stories!

049  |  Data Journalism at ProPublica w/ Scott Klein

048  |  Vis Going Mainstream w/ Stamen's CEO Eric Rodenbeck

047  |  Moritz and Enrico on Books, Data Literacy, Their Projects, Etc.

046  |  Year 2014 Review w/ Robert Kosara and Andy Kirk

045  |  Nicholas Felton

044  |  Tamara Munzner

043  |  IEEE VIS'14

042  |  Santiago Ortiz

041  |  With Lisa Strausfeld

040  |  Narrative Visualization Research w/ Jessica Hullman

039  |  DensityDesign w/ Paolo Ciuccarelli

038  |  Visual Complexity w/ Manuel Lima

037  |  The Challenge of Teaching Visualization w/ Scott Murray and Andy Kirk

036  |  Data Art w/ Jer Thorp

035  |  Visual Storytelling w/ Alberto Cairo and Robert Kosara

034  |  Data journalism w/ Simon Rogers

033  |  HelpMeViz w/ Jon Schwabish

032  |  High Density Infographics and Data Drawing w/ Giorgia Lupi

031  |  Review, preview w/ Robert Kosara and Andy Kirk

030  |  The Information Flaneur w/ Marian Dörk

029  |  Treemaps w/ Ben Shneiderman

028  |  IEEE VIS'13 Highlights w/ Robert Kosara

027  |  Big Data Skepticism w/ Kate Crawford

026  |  Visualization Beyond the Desktop w/ Petra Isenberg

025  |  Visualization on Mobile & Touch Devices w/ Dominikus Baur

024  |  The VAST Challenge: Visual Analytics Competitions with Synthetic Benchmark Data Sets

023  |  Inspiration or Plagiarism? w/ Bryan Connor and Mahir Yavuz

022  |  NYT Graphics and D3 with Mike Bostock and Shan Carter

021  |  Can visualization save the world? With Kim Rees and Jake Porway

020  |  On Maps. With Michal Migurski.

019  |  With Santiago Ortiz

018  |  Happy Birthday, Data Stories!

017  |  Data Sculptures

016  |  What Was Big in 2012 and What Is Coming in 2013

015  |  With Robert Kosara

014  |  Data Stories Hangout

013  |  from Visweek 2012

012  |  Alberto Cairo and "The Functional Art"

011  |  emoto (with Stephan Thiel from Studio NAND)

010  |  Hand crafted data (with Stefanie Posavec)

009  |  Bridging academia and industry with Danyel Fisher

008  |  Interview with Jeff Heer

007  |  Color (feat. Gregor Aisch)

006  |  On Food

005  |  How To Learn Data Visualization (with Andy Kirk)

004  |  Malofiej 20 (with Andy Kirk)

003  |  How do you evaluate visualization?

002  |  Visualization Contests, Marathons, Challenges, Awards, Etc.

001  |  Exuberant Animated Data Kitsch

Subscribe

Slack community chat

Join our slack community to discuss the show, suggest guests and chat with other listeners!

0 / 872

Privacy policy

Subscribe by email

  • Data Stories Email Newsletter All new content delivered to your email inbox. Never miss an episode!

Podcast channels

  • Podcast feed (m4a) The data stories audio episodes, in .m4a format.
  • Podcast feed (mp3) The data stories audio epsiodes, in .mp3 format
  • Subscribe in iTunes Subscribe to us in iTunes
  • Subscribe to us on Stitcher

Contact

  • @datastories Follow and contact us on twitter!
  • mail@datastori.es Do get in touch!

Support us

  • Patreon
  • Paypal
Built with Make. Your friendly WordPress page builder theme.
  • Twitter
  • Email
  • RSS