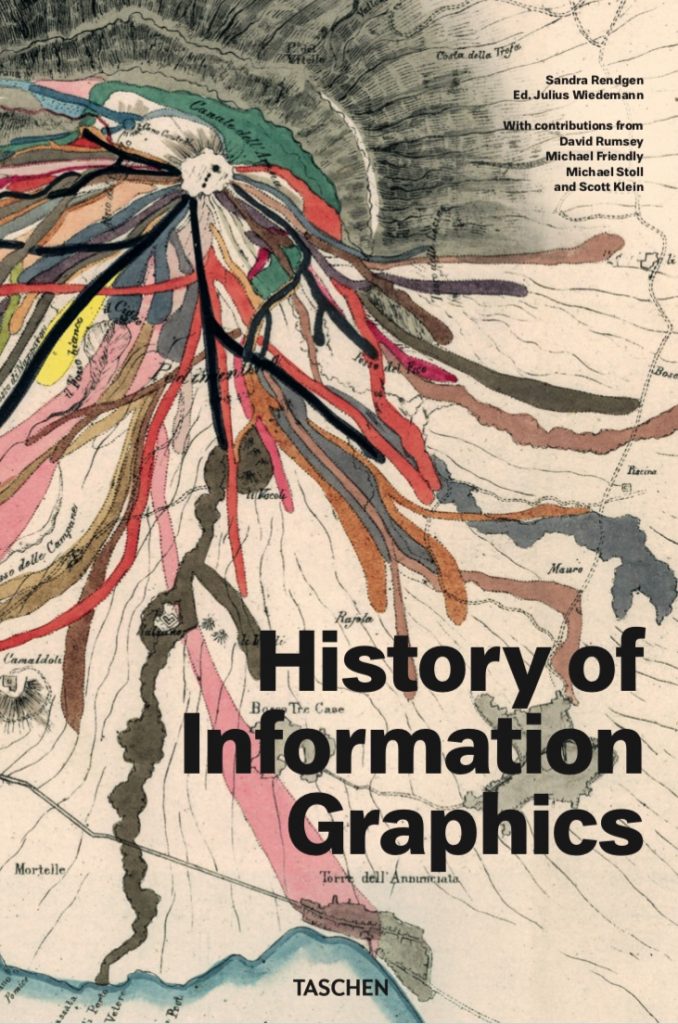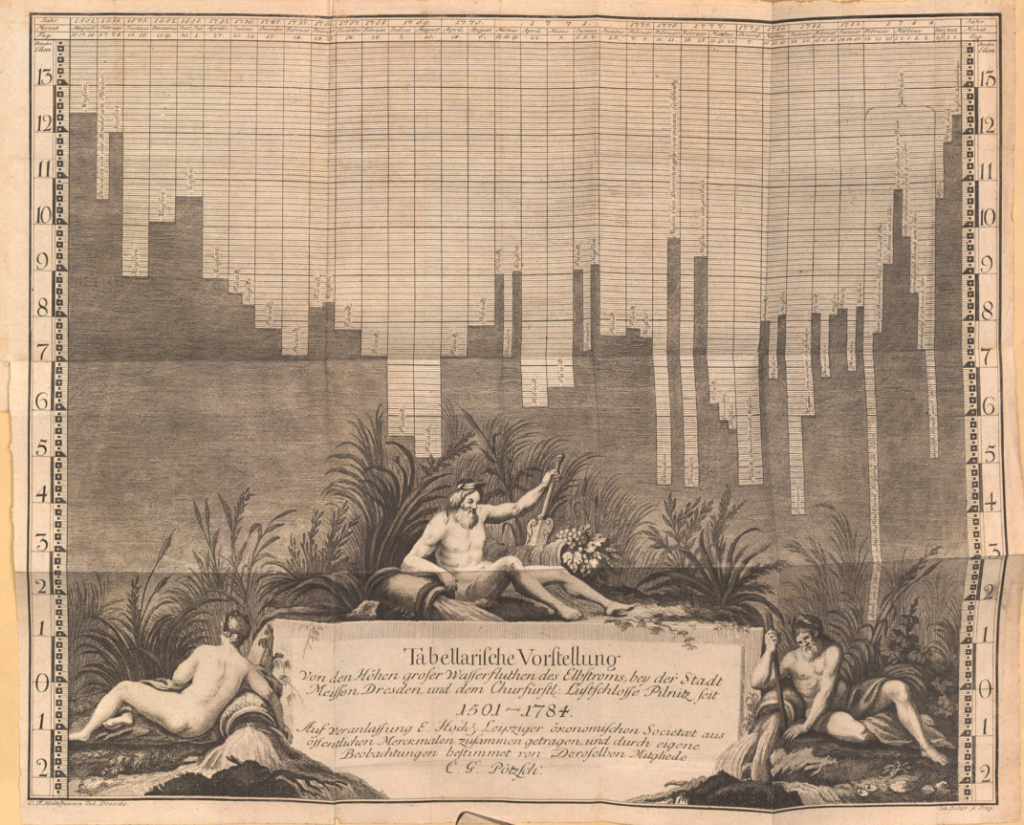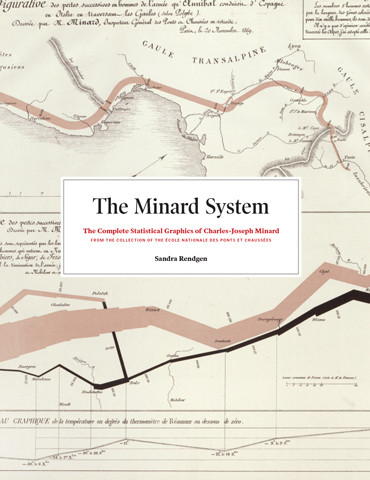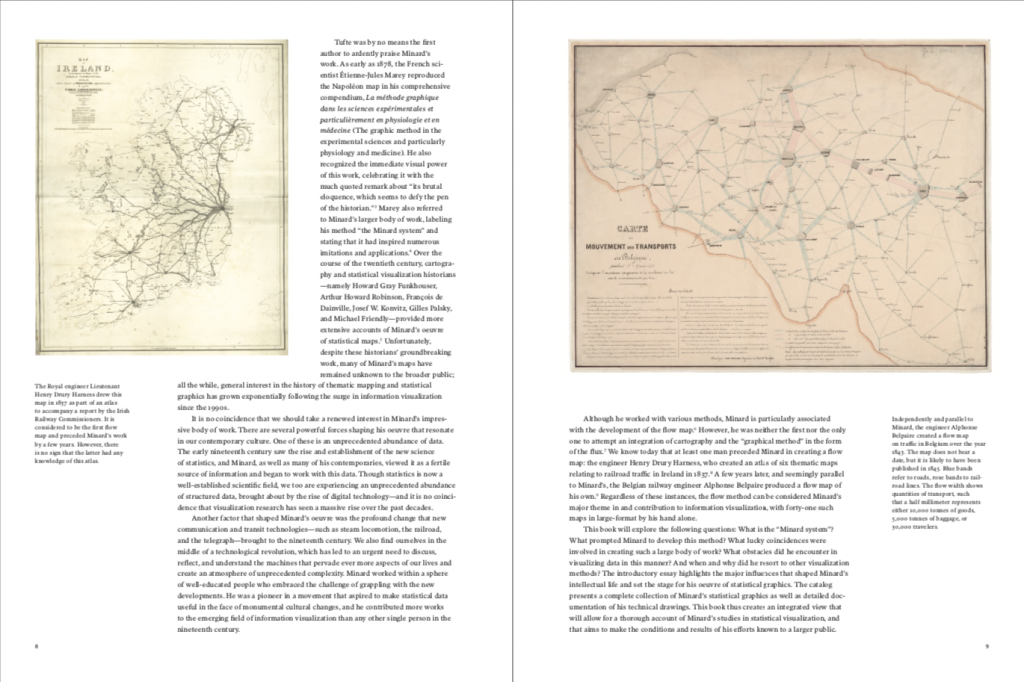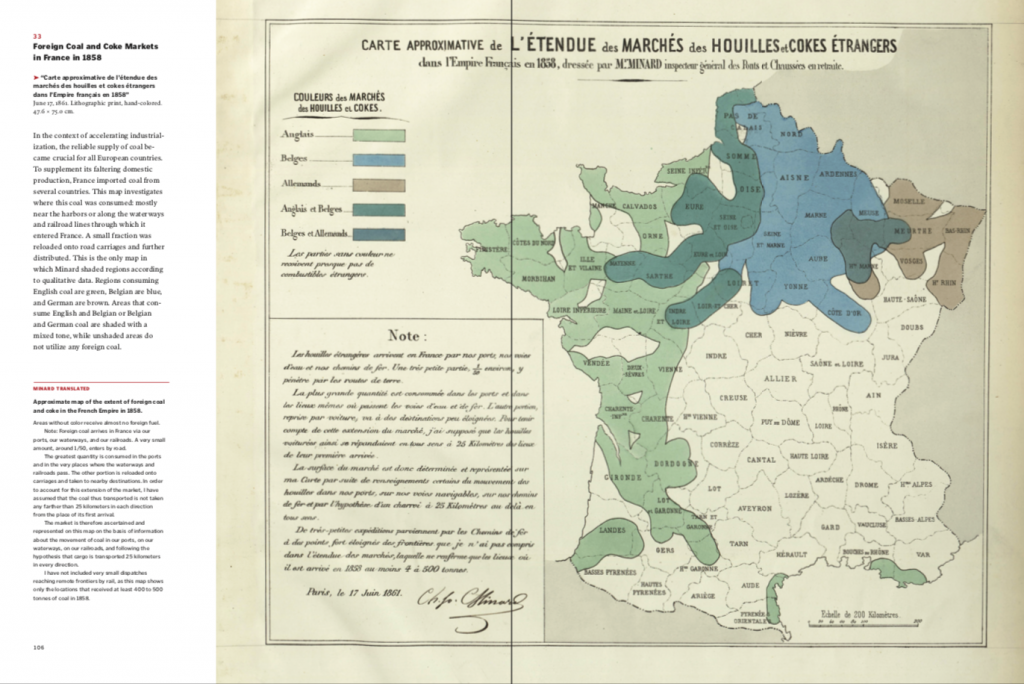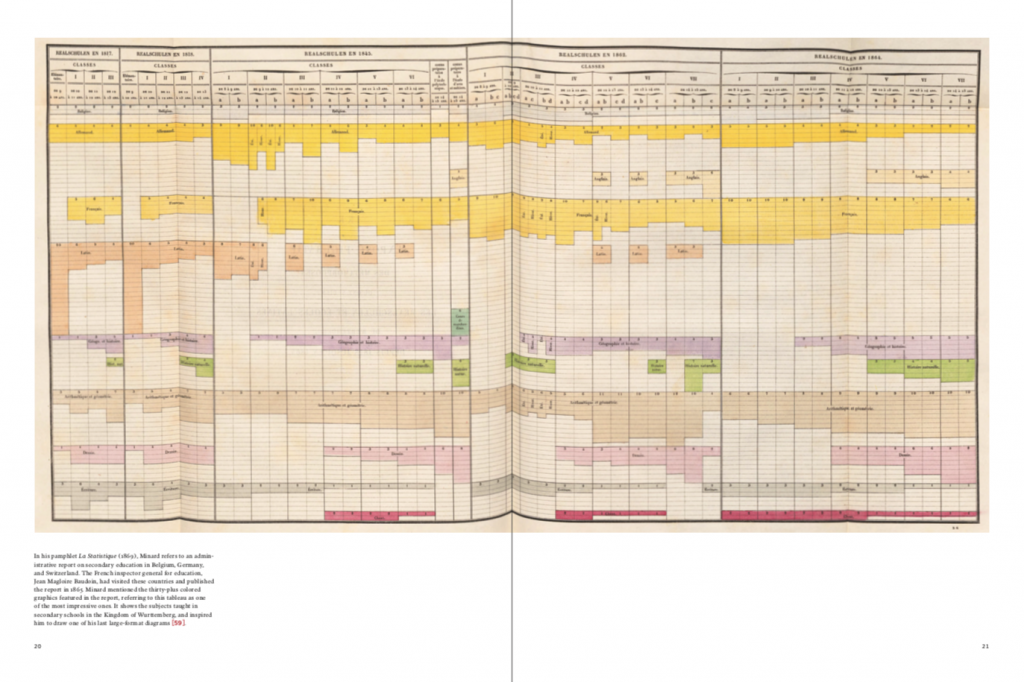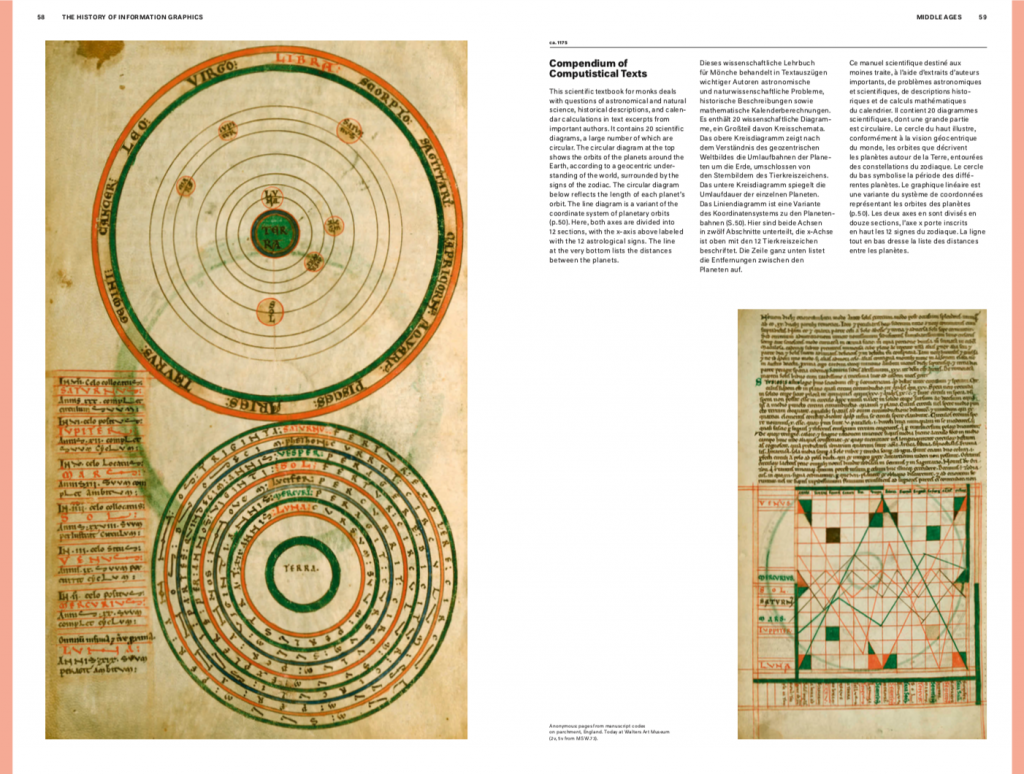
We have art historian Sandra Rendgen on the show to talk about where data visualization comes from. Sandra published two great books on the topic, one called “The Minard System”, on the great Minard and the “History of Information Graphics” with contributions from multiple authors.
On the show we talk about graphical systems in the middle ages, the great efforts in scientific cartography in the age of discovery and the innovation spurred by statistic al thinking and associated graphical formats.
As a final note: Sandra is also now our new producer! We are very happy to have her on board. Welcome Sandra! Our former producer Destry is now busy with her baby and we are very grateful for the fantastic work she has done for the show over the years.
[Our podcast is fully listener-supported. That’s why you don’t have to listen to ads! Please consider becoming a supporter on Patreon or sending us a one-time donation through Paypal. And thank you!]
Links
- Preview: The Middle Ages in Infographics
- Paper: Golden Age of Statistical Graphics
- History: Raise the Bar (1770s)
- Book: The Minard System
- Book: History of Information Graphics
