[If you like what we do, please consider supporting us on Patreon or sending us a one-time donation through Paypal. Data Stories runs thanks to your financial support!]
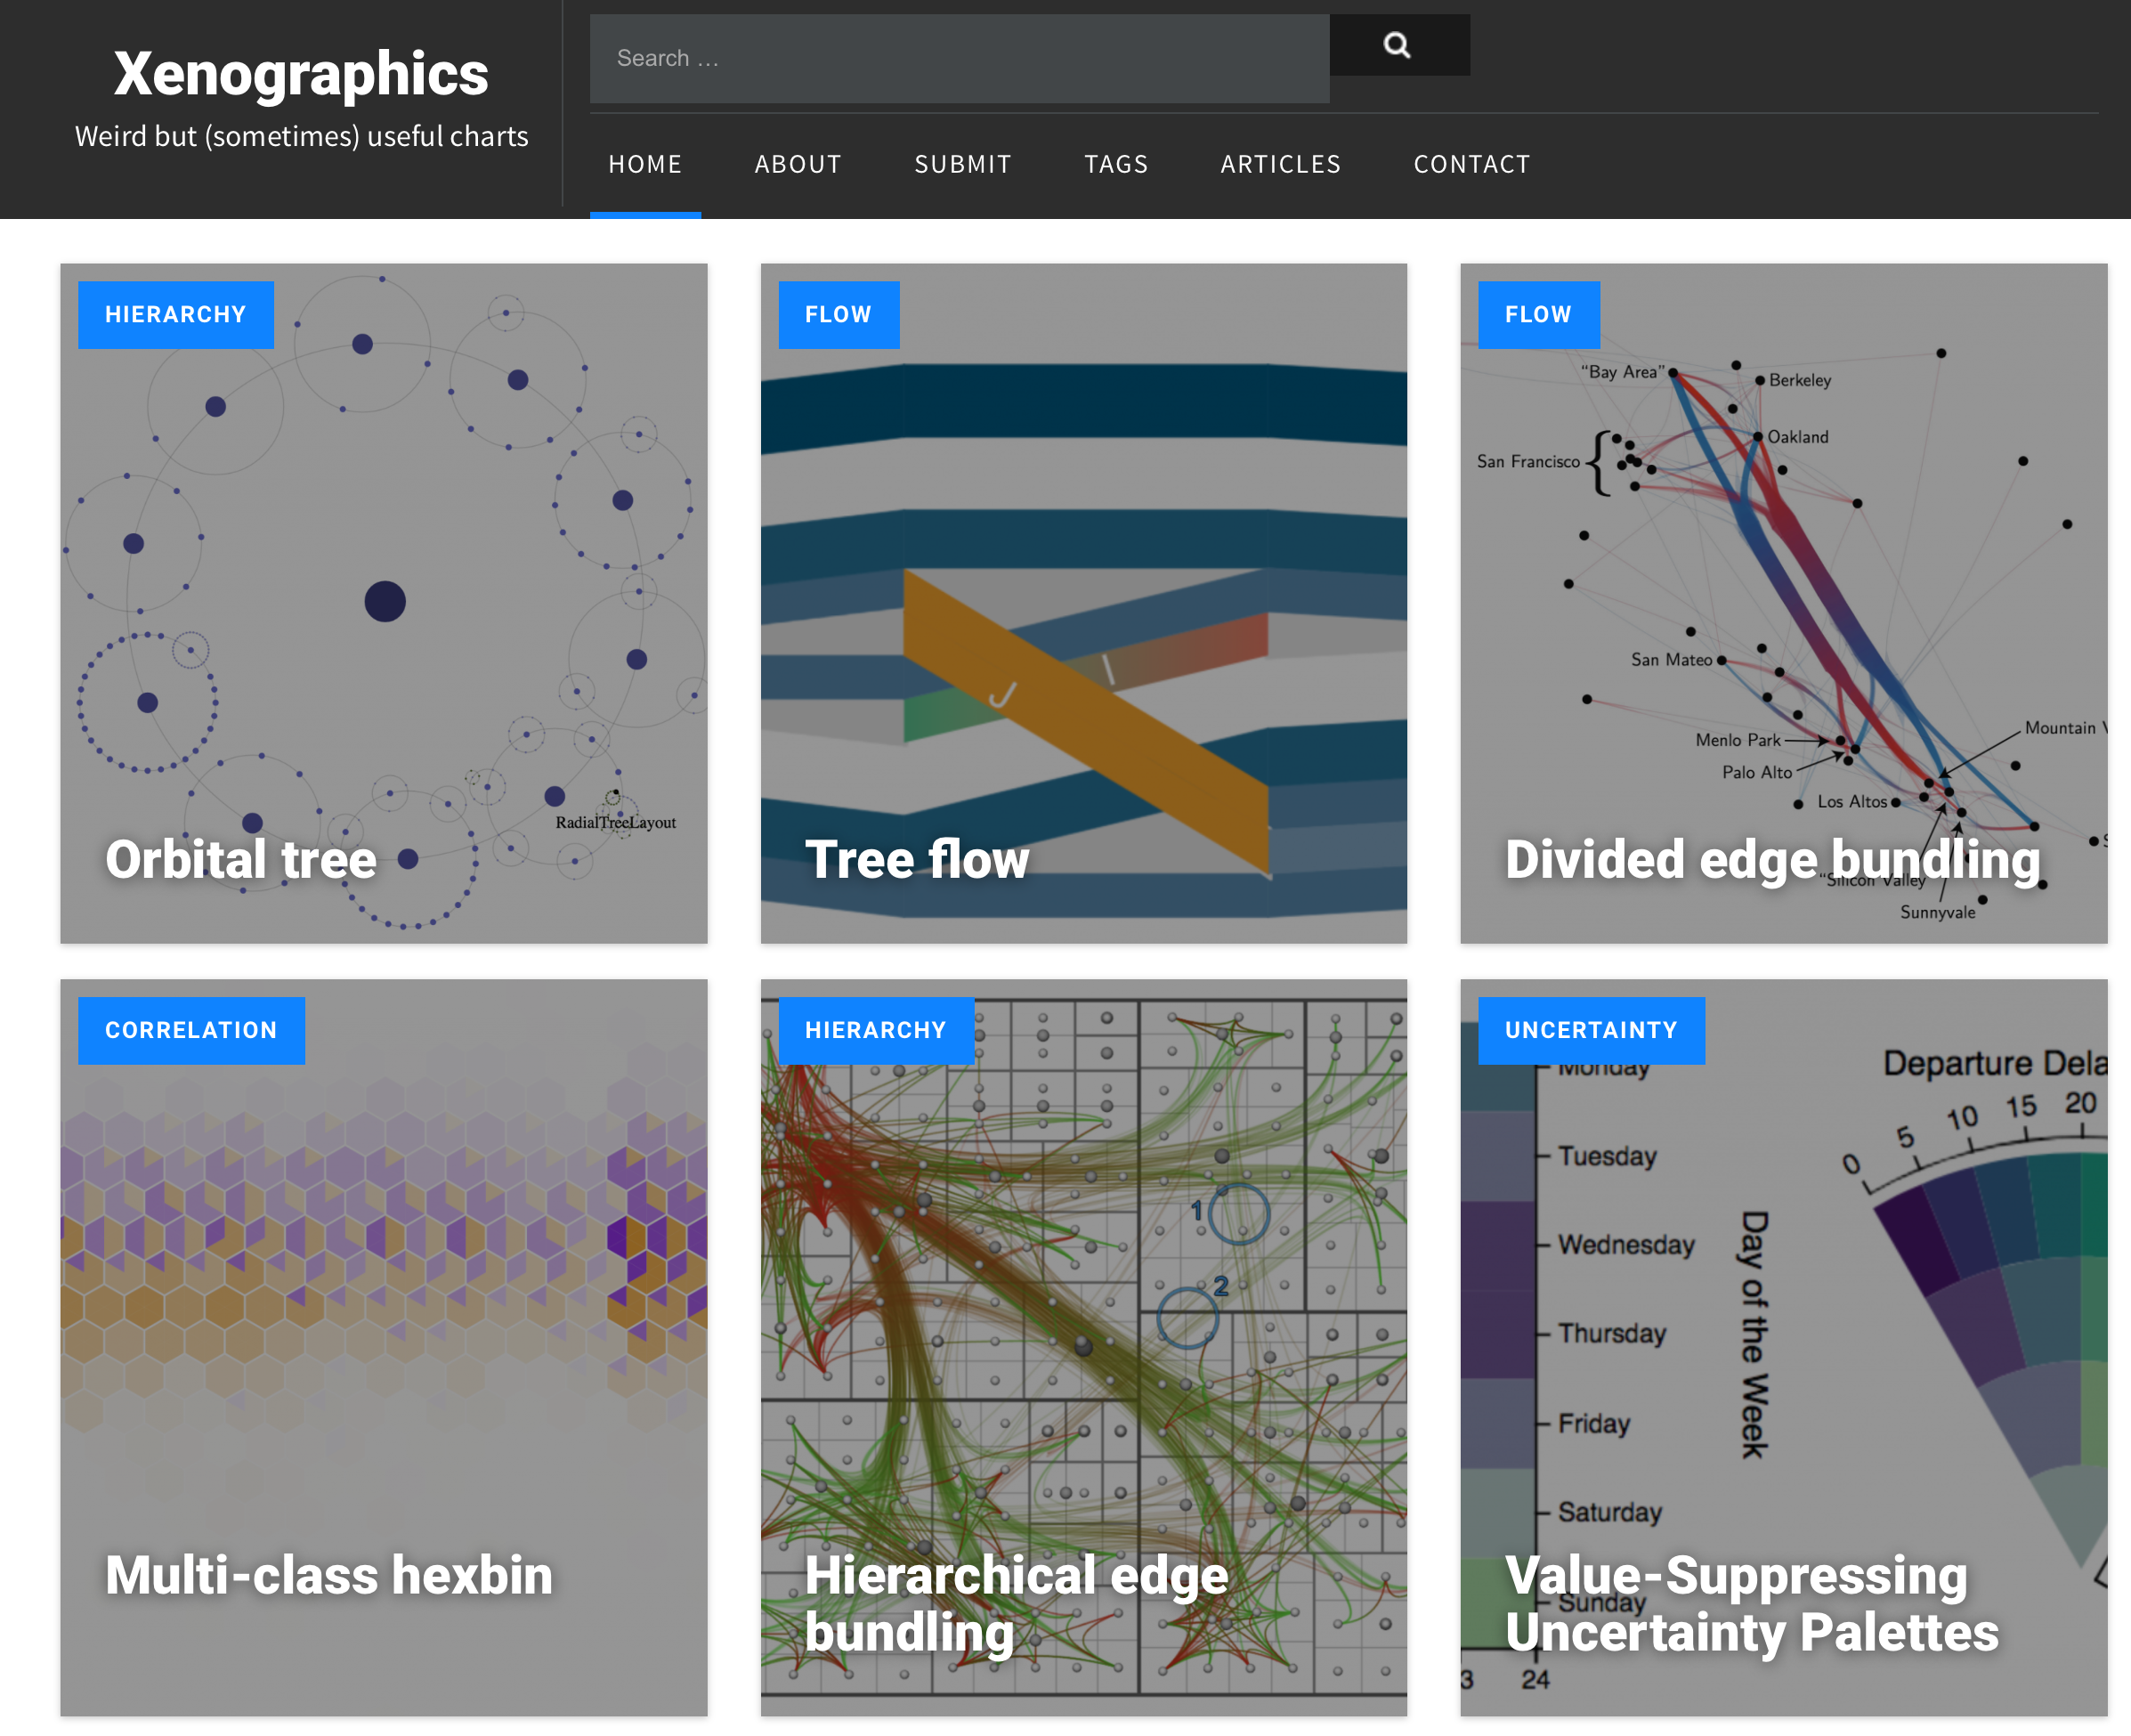
Most often in data visualization we depend on traditional charts, but occasionally we stumble onto something new, maybe even something weird: something that is interesting and beautiful. How many charts of this type exist? And do they have anything in common?
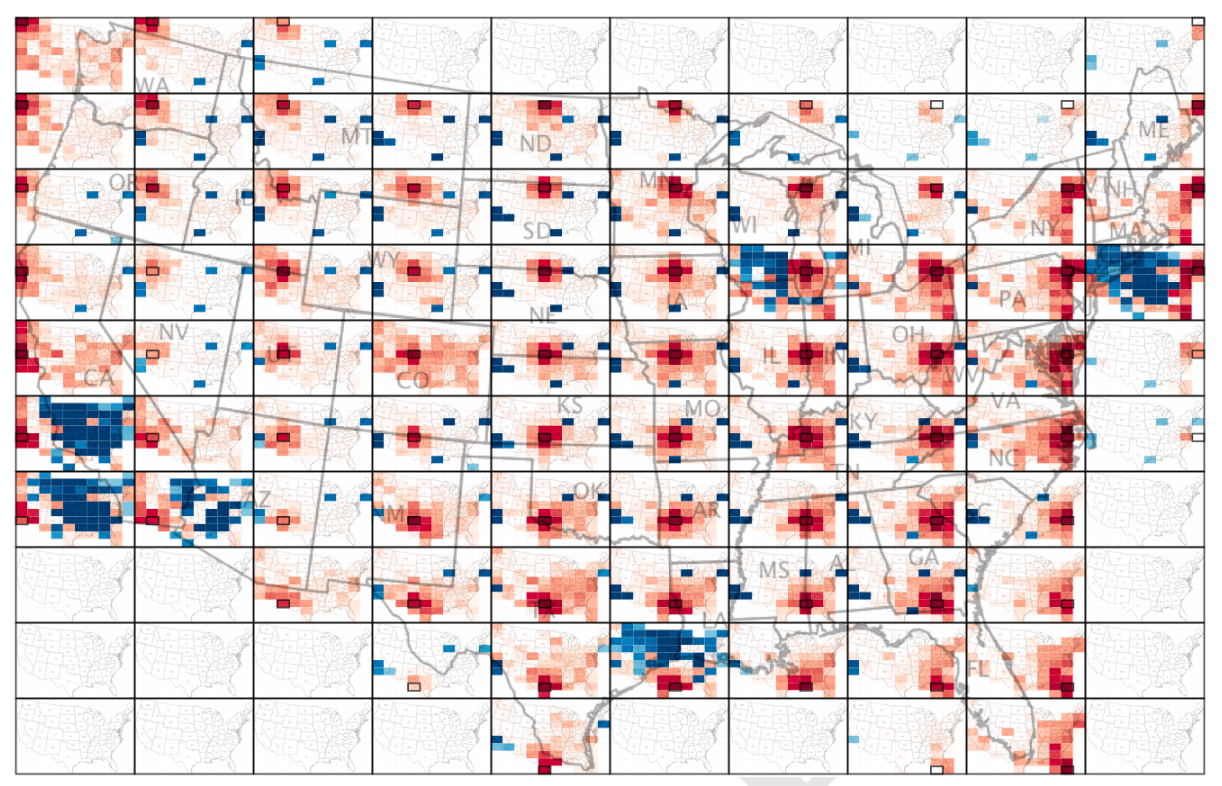
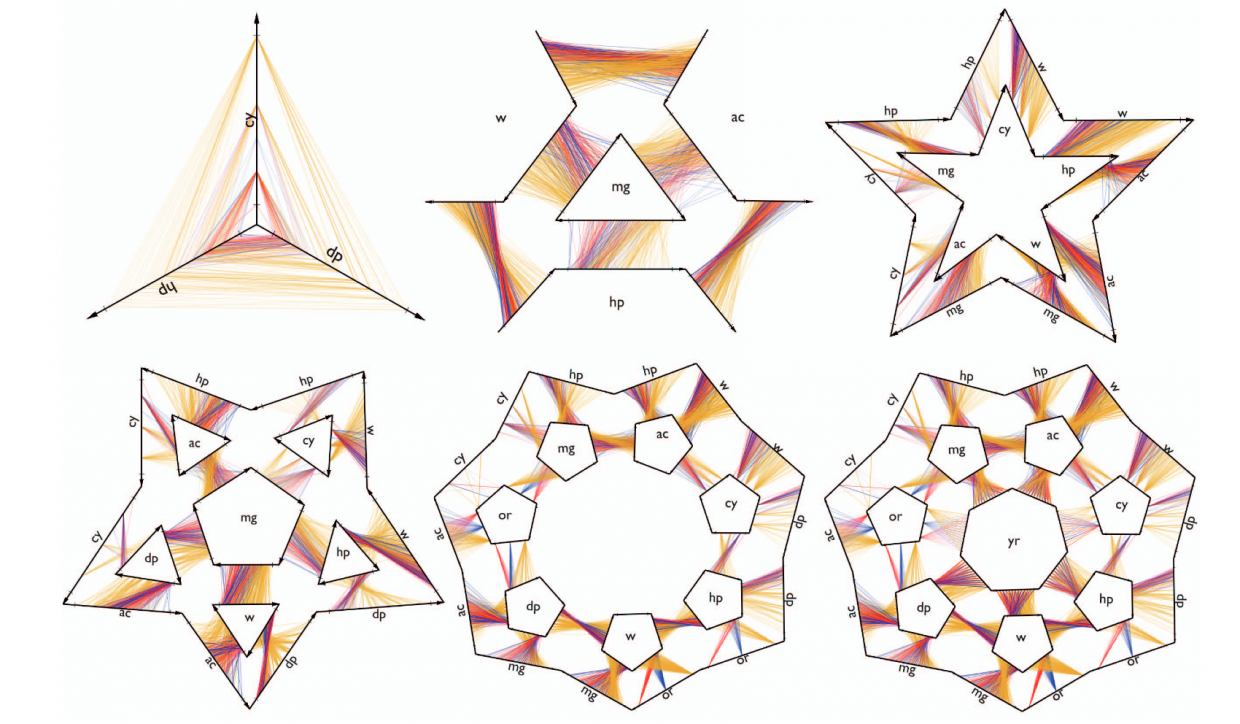
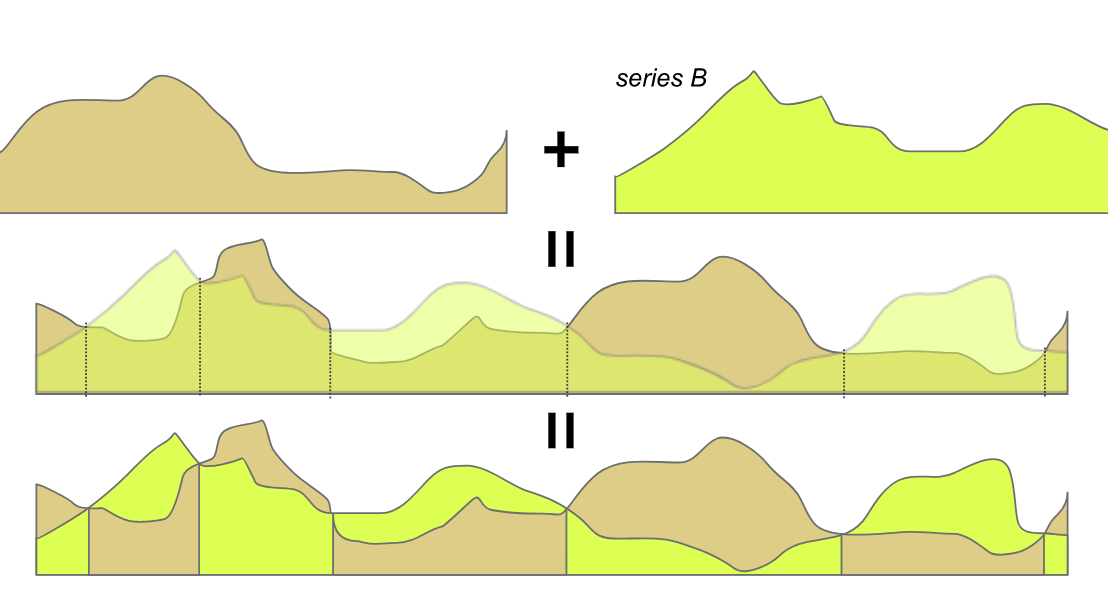
In this episode we have Maarten Lambrechts on the show to talk about his Xenographics project: a growing collection of “unusual charts and maps.”
We talk with Maarten about examples of xenographics, the system Maarten developed to organize the collection, the role of innovation in visualization, and the future of these unusual designs.
We hope you enjoy the show!
Links
- Maarten Lambrechts
- Xenographics
- Rock and Poll
- Eurosearch Song Contest (2017, 2018)
- RAW visualization tool
- Mike Bostock
- Location + time: urban data visualization
- Steve Haroz’s collection of open access vis papers