[Our podcast is fully listener-supported. That’s why you don’t have to listen to ads! Please consider becoming a supporter on Patreon or sending us a one-time donation through Paypal. And thank you!]
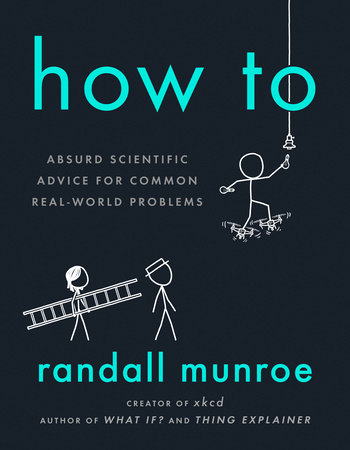
This episode is a dream come true – we have long wanted to invite Randall Munroe to the show. Randall is the mastermind behind the xkcd webcomics which have zillions of fans around the globe. In his stick figure cartoons and hilarious mini-stories, he comments on complicated scientific issues.
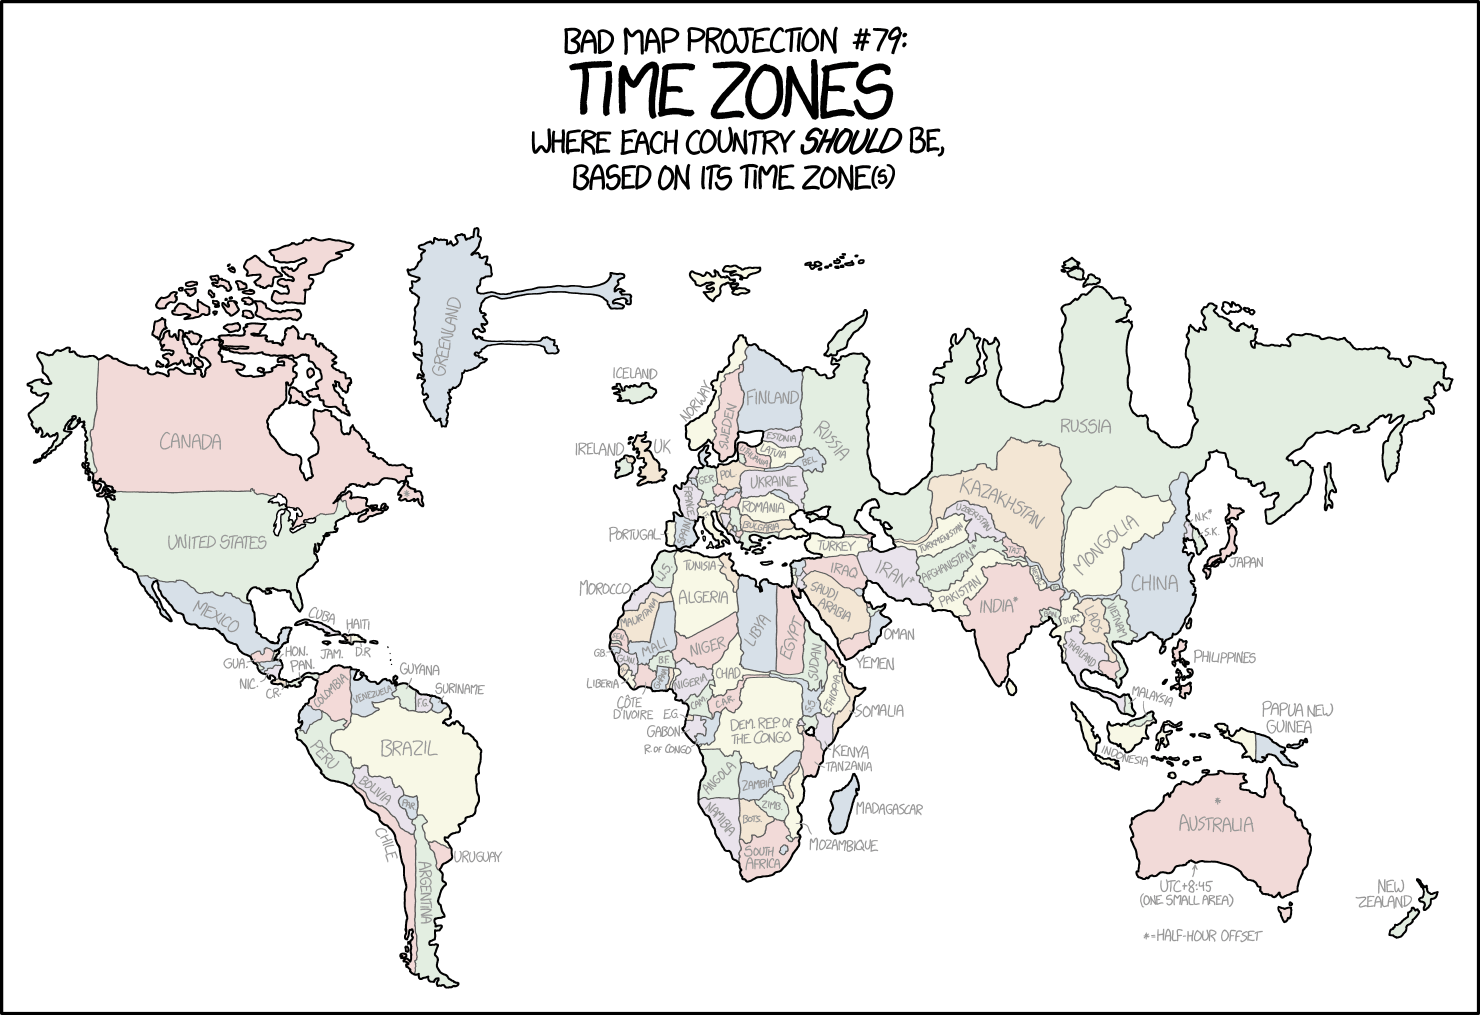
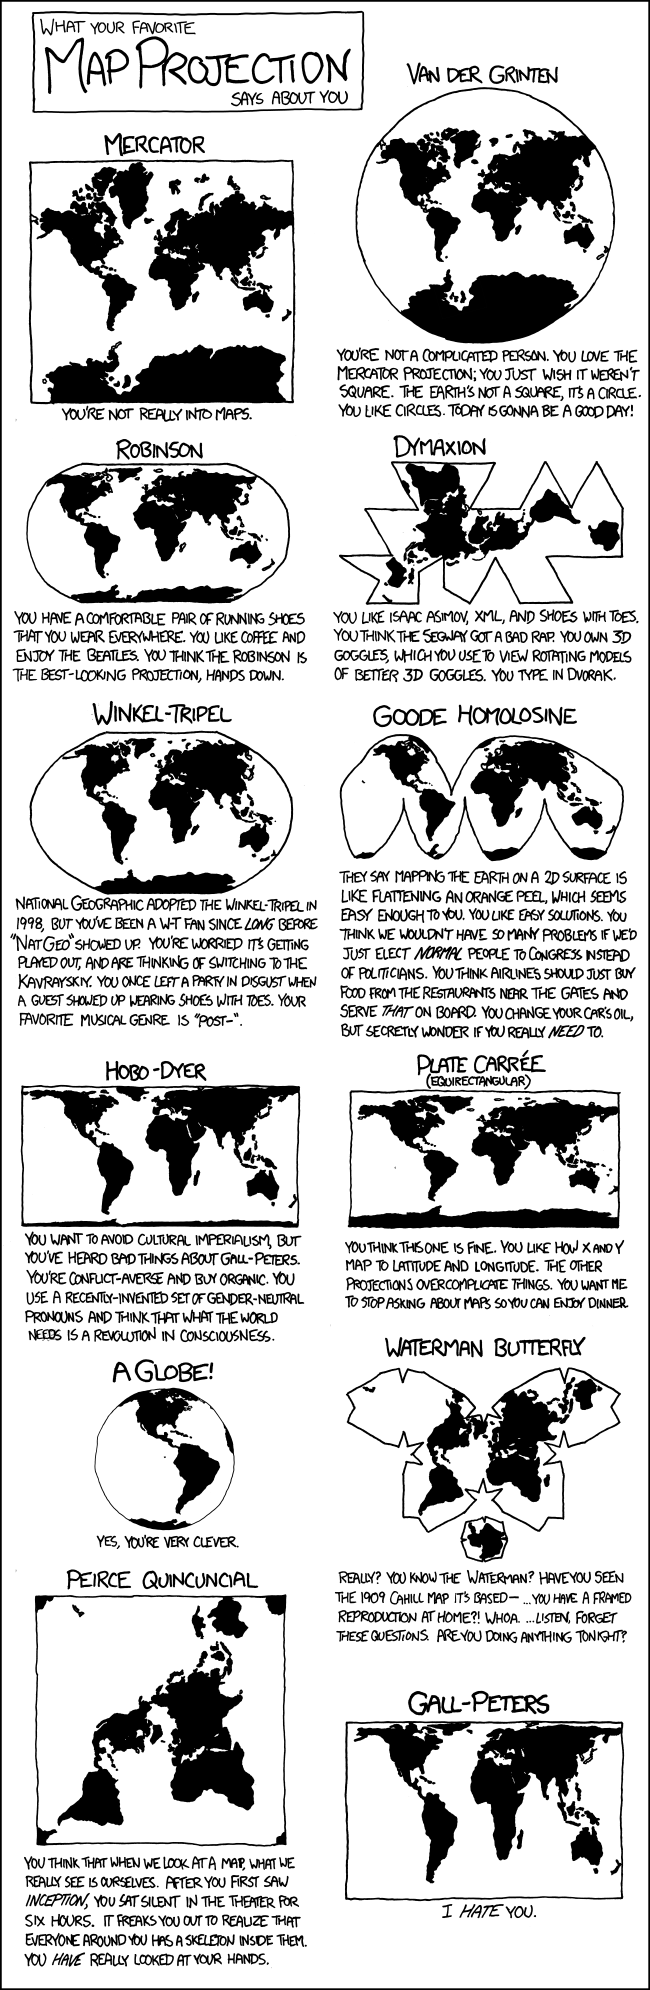
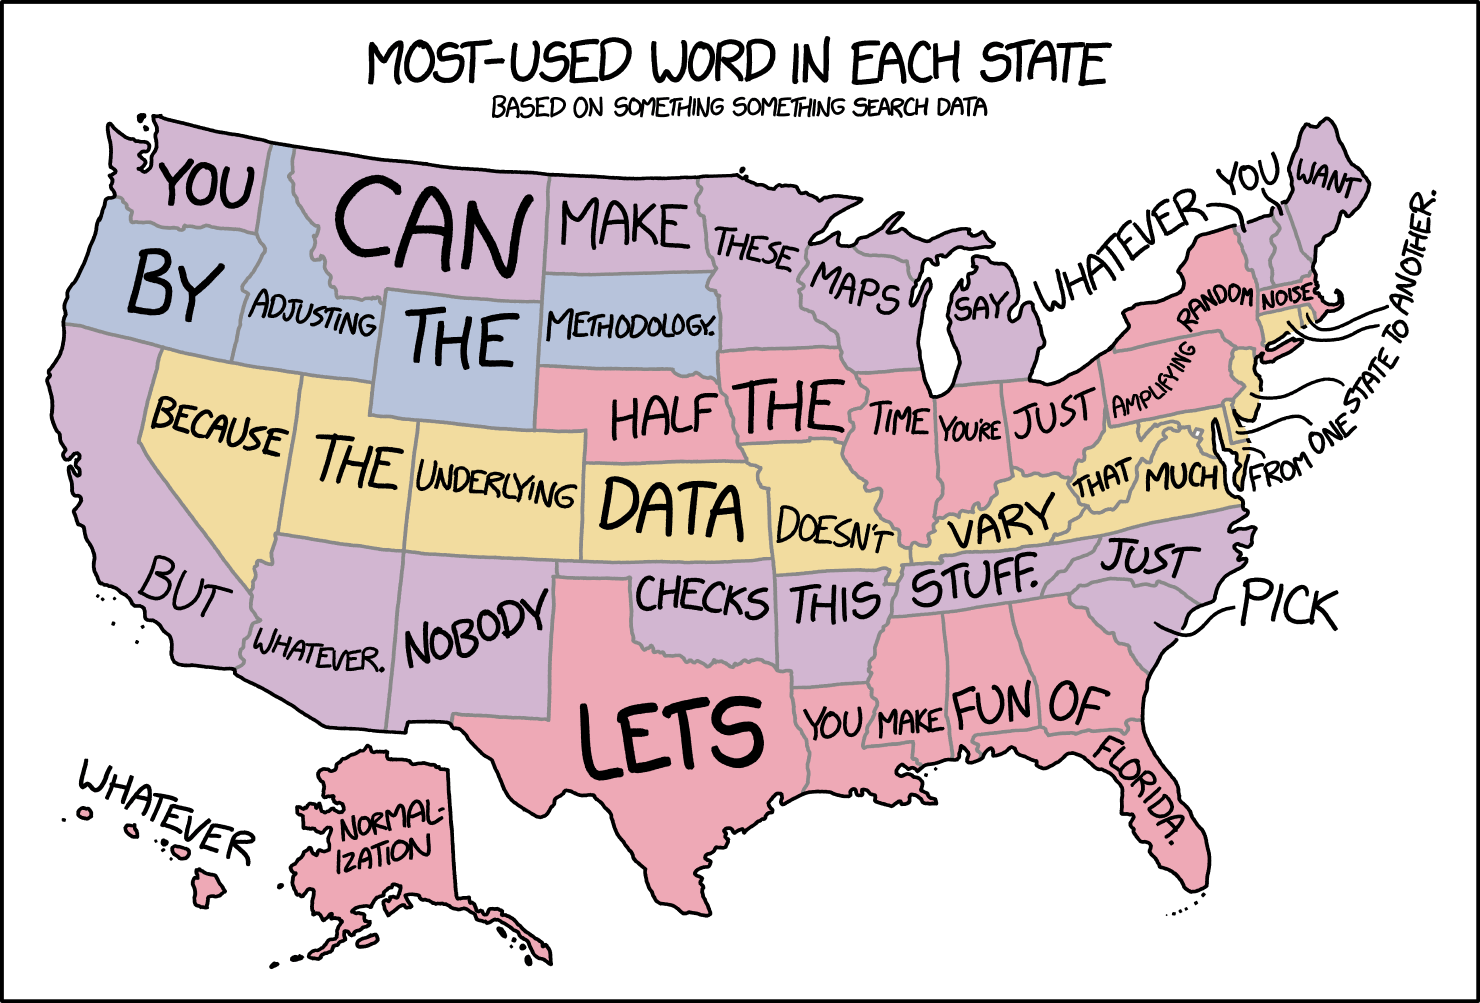
Over the years, Randall has also created a number of data-heavy visualizations. Some of them tackle pressing issues such as climate change, while others mock conventions of visualization such as map projections or chart types.
On the show we talk about his latest book “How To”, his work process, and the relation of complexity and simplicity in his visualizations. Enjoy the show and please make sure to listen all the way to the end, because Randall is calling out for some internet wisdom. Can anyone help find a software tool for manipulating maps in a three-point azimuthal projection?
Links:
xkcd: A webcomic of romance, sarcasm, math, and language.
How to! Scientific advice for common real world problems
The Money Chart
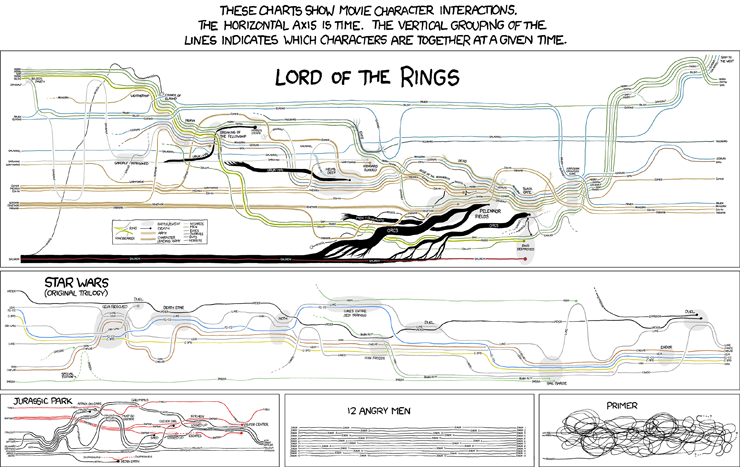
The Movie Narratives Chart
Earth Temperature Timeline