[Thinking of gift-giving this holiday season? Consider a gift to Data Stories! You can join our growing community of Patreons or make a one-time donation to us on Paypal.]
“Would you define this as a dashboard?” The question provoked quite a reaction!
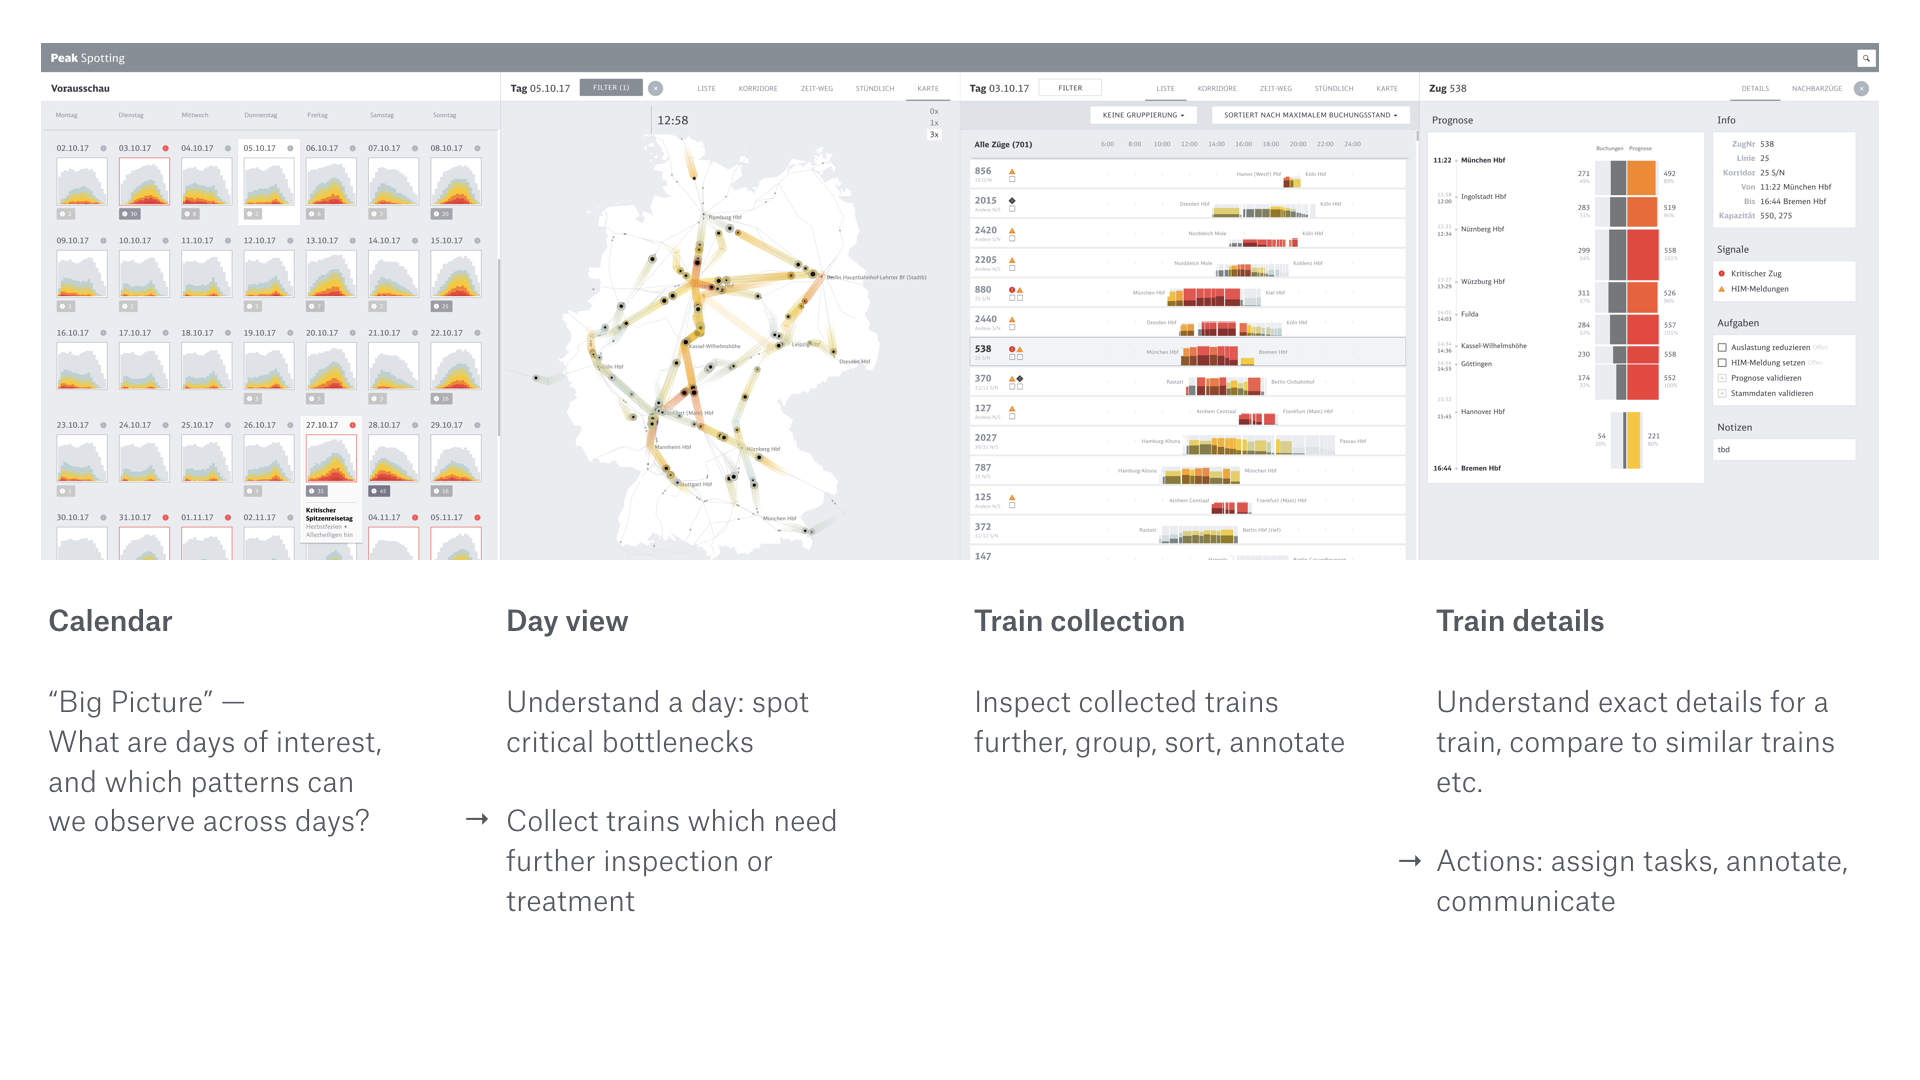
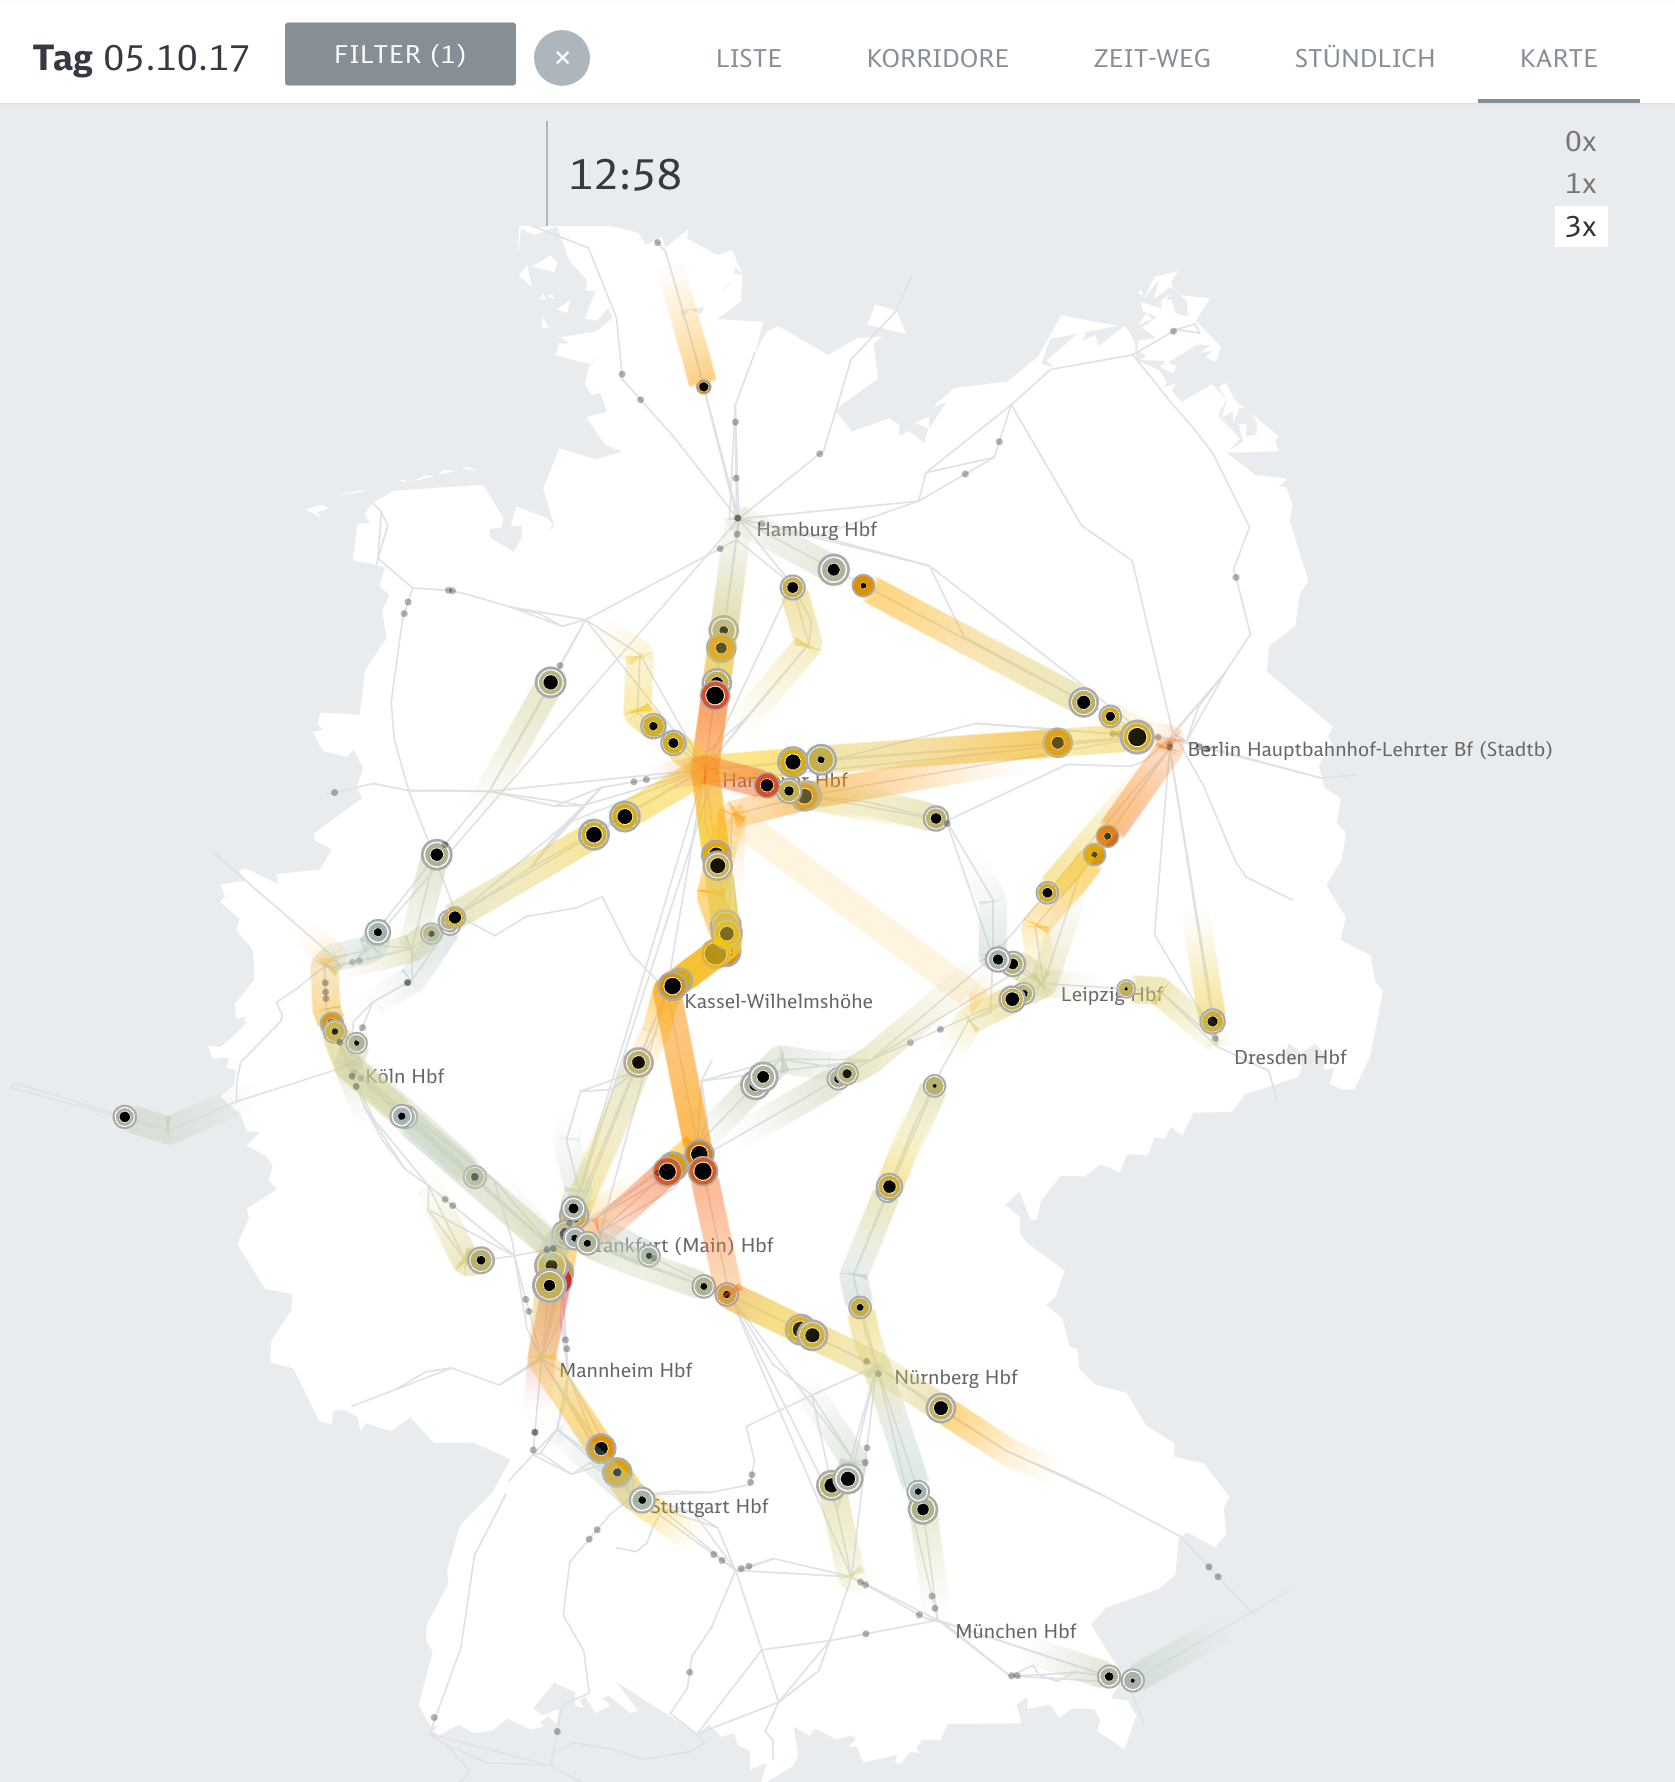
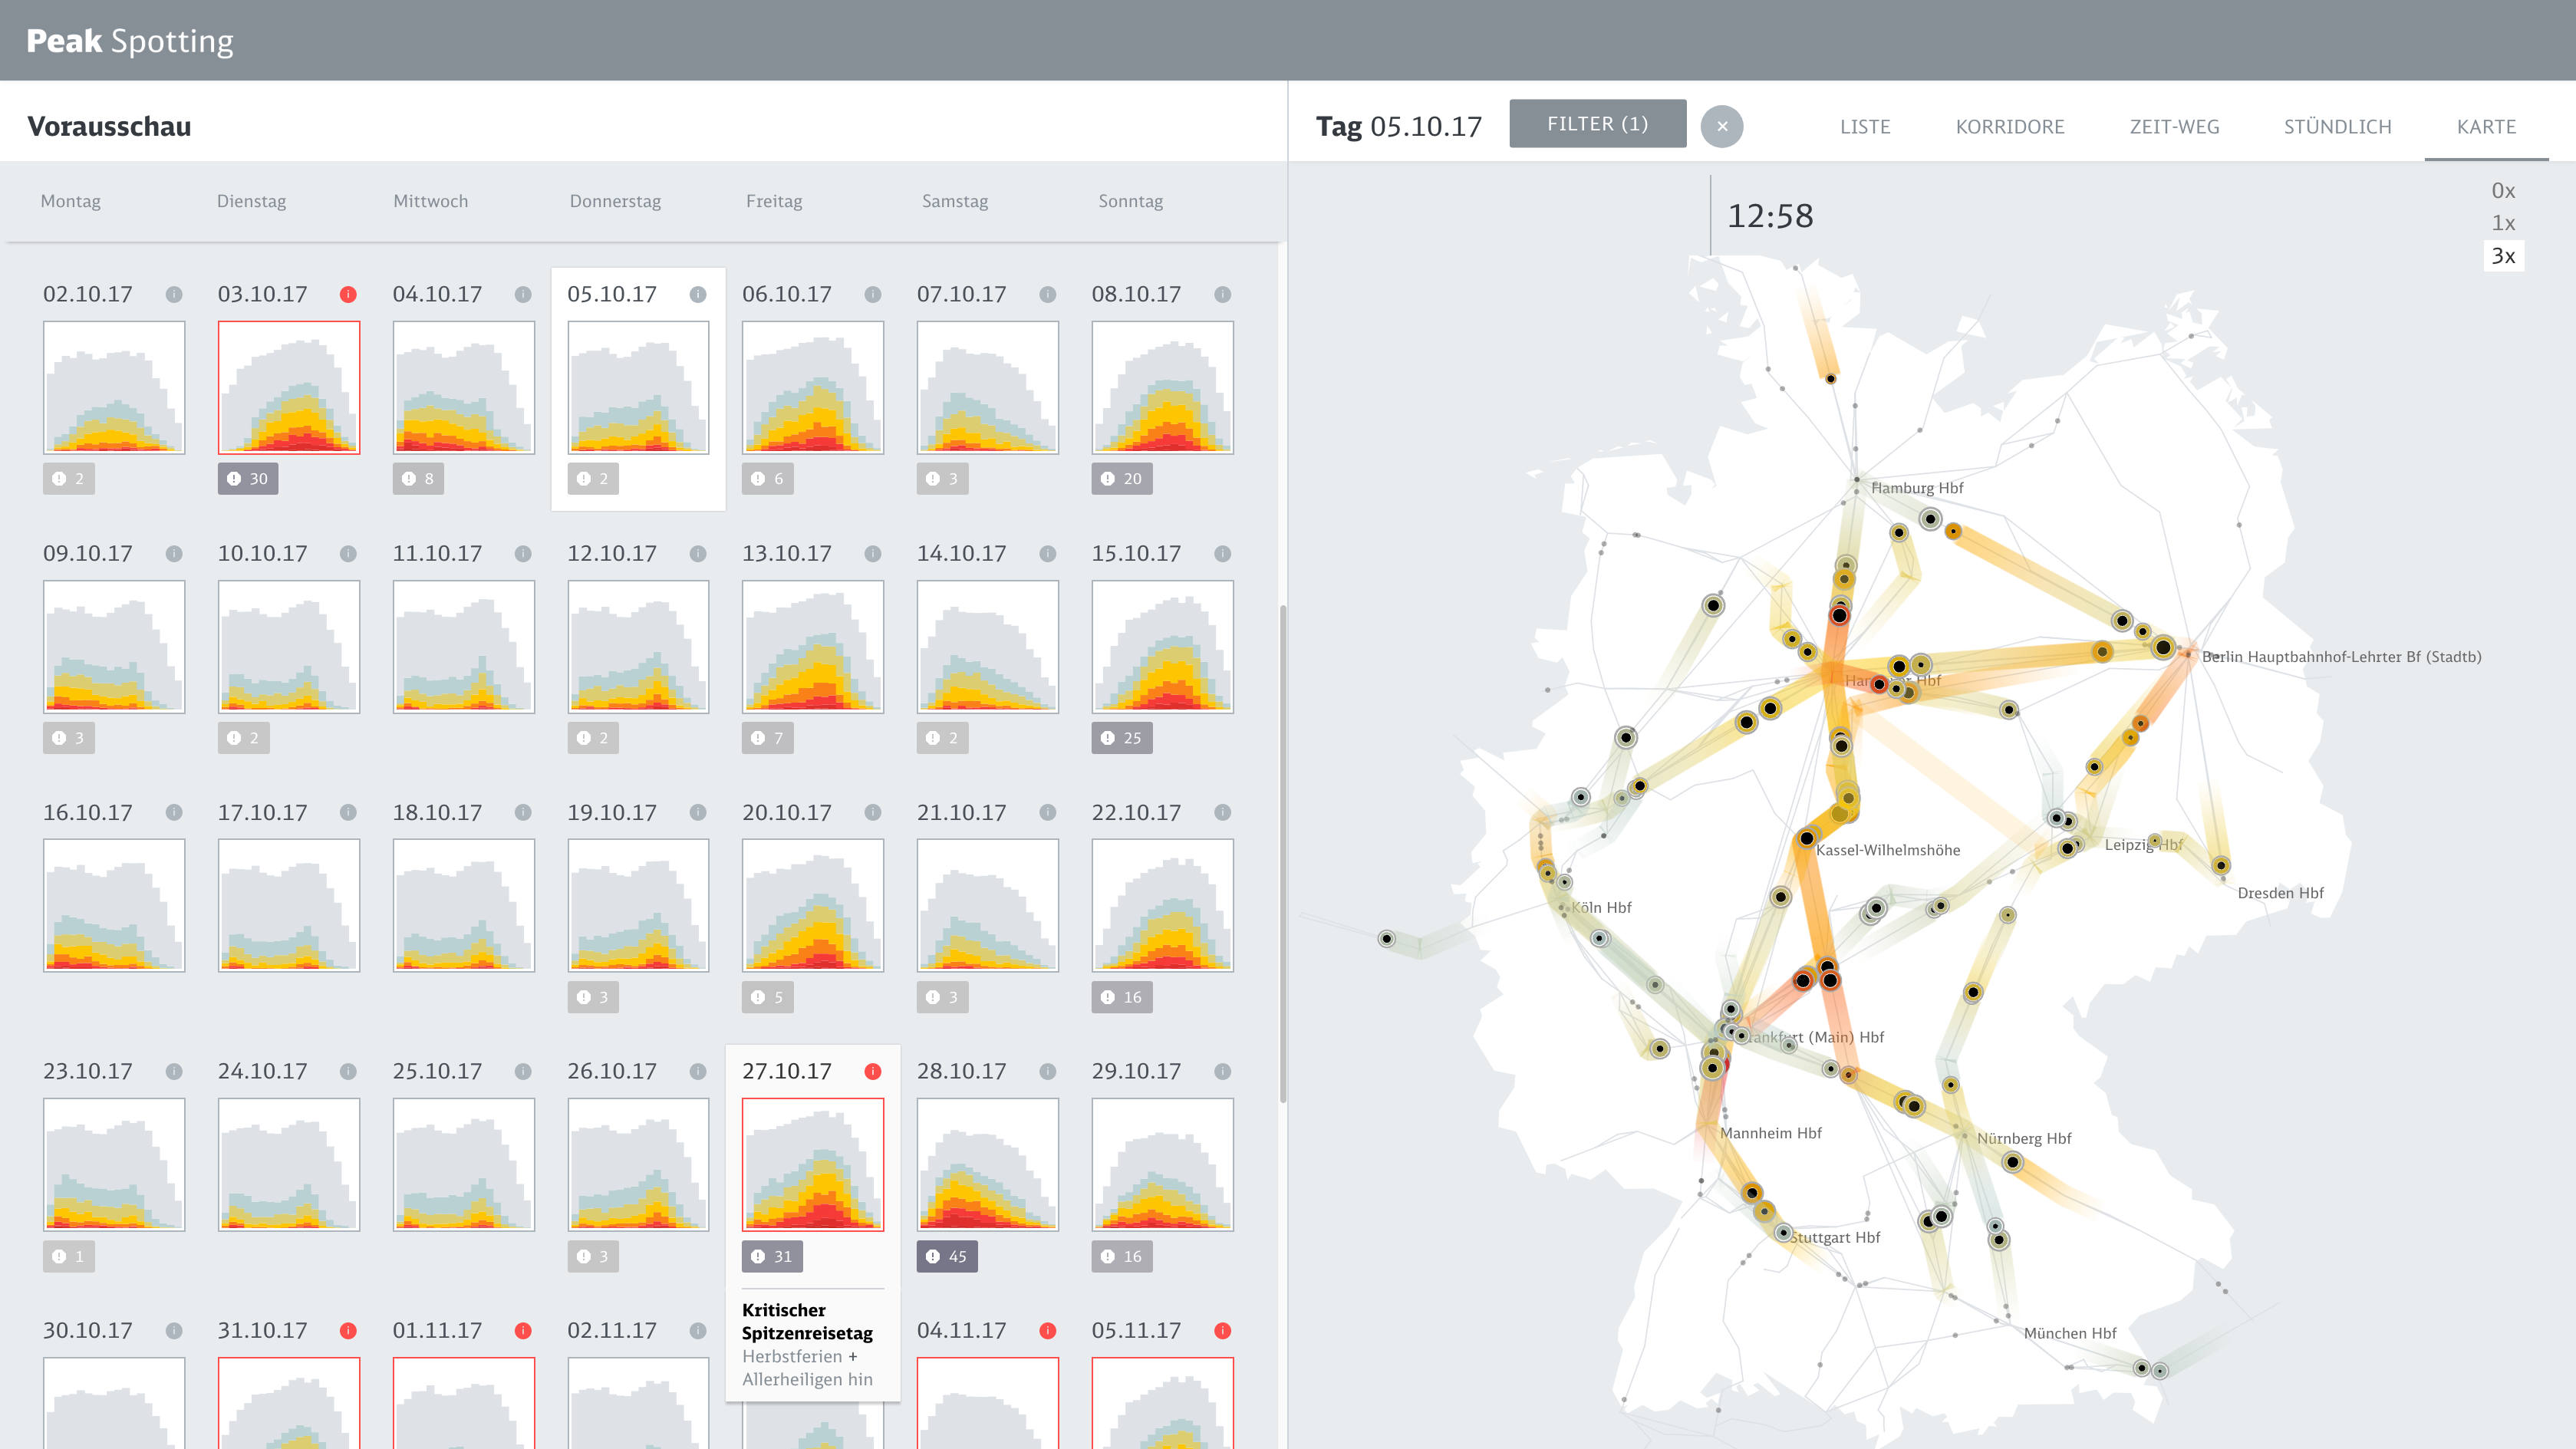
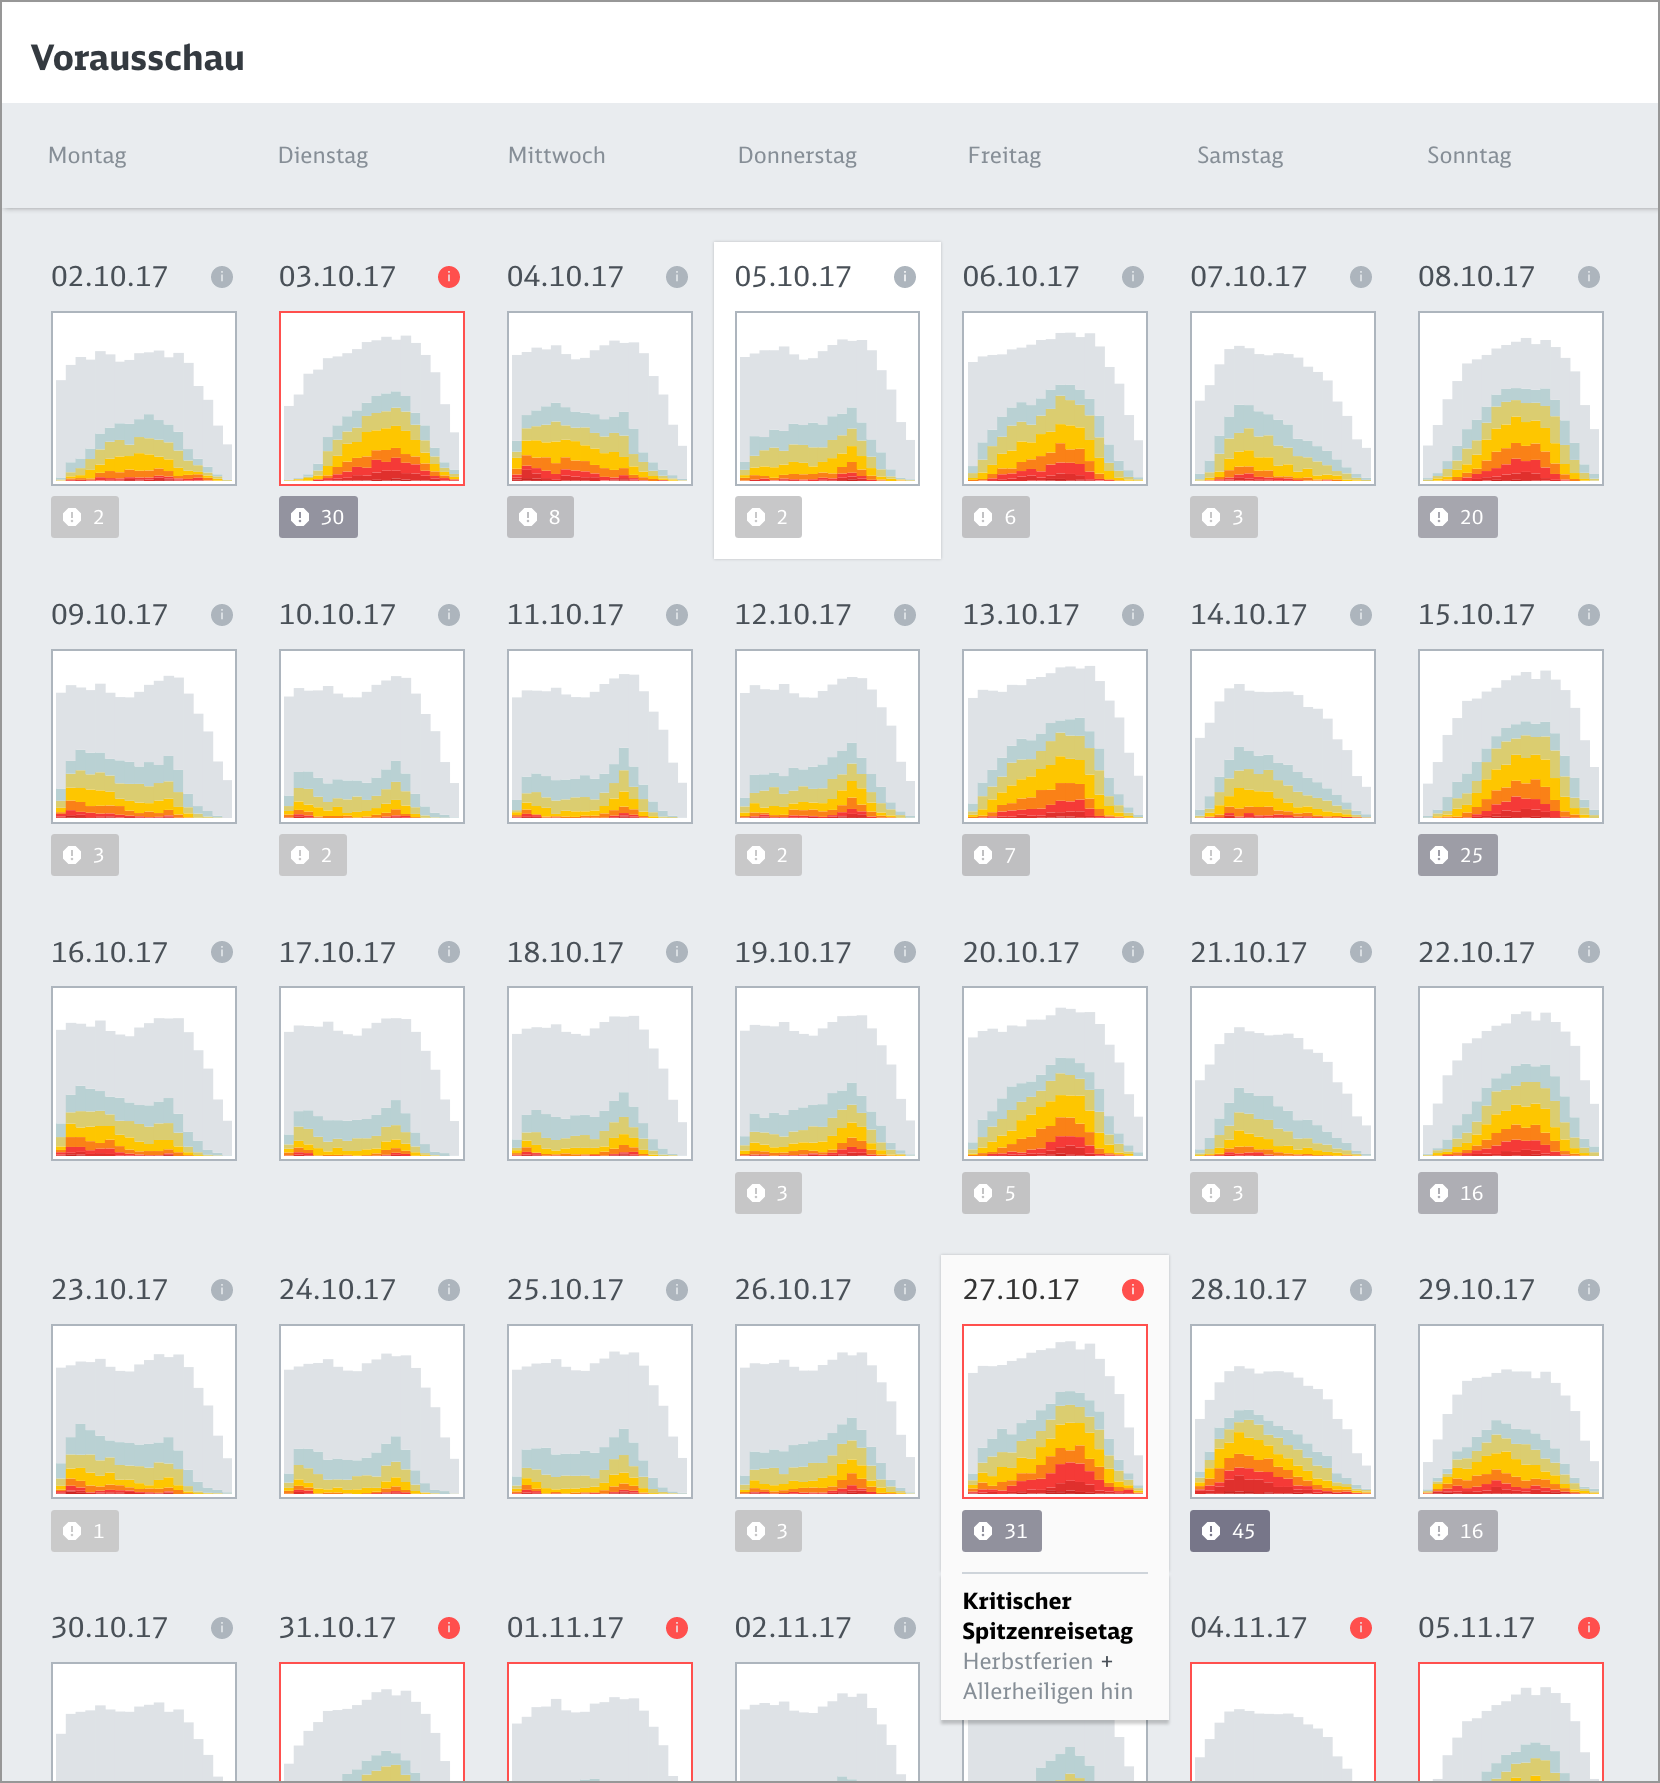
In this episode, we talk about Peak Spotting, a new data visualization tool designed to help capacity managers at the German railway Deutsche Bahn handle passenger loads within the train system.
We recorded the episode live in Berlin, all together in the same room, with Moritz, the creative lead of the project, as well as the project’s other collaborators: project director Christian Au, technical lead Stephan Thiel, and designer Christian Laesser.
We talk about how the project started, the process the team followed to design the tool, how people at the German railway are using it, finding innovation within big companies, and the role of visualization in the movement towards automation.
Enjoy the show!
Links
-
- Moritz’s OpenVisConf keynote
-
- Moritz’s writeup of the project
-
- Studio NAND’s writeup of the project
- Christian Laesser’s writeup of the project