[Our podcast is fully listener-supported. That’s why you don’t have to listen to ads! Please consider becoming a supporter on Patreon or sending us a one-time donation through Paypal. And thank you!]
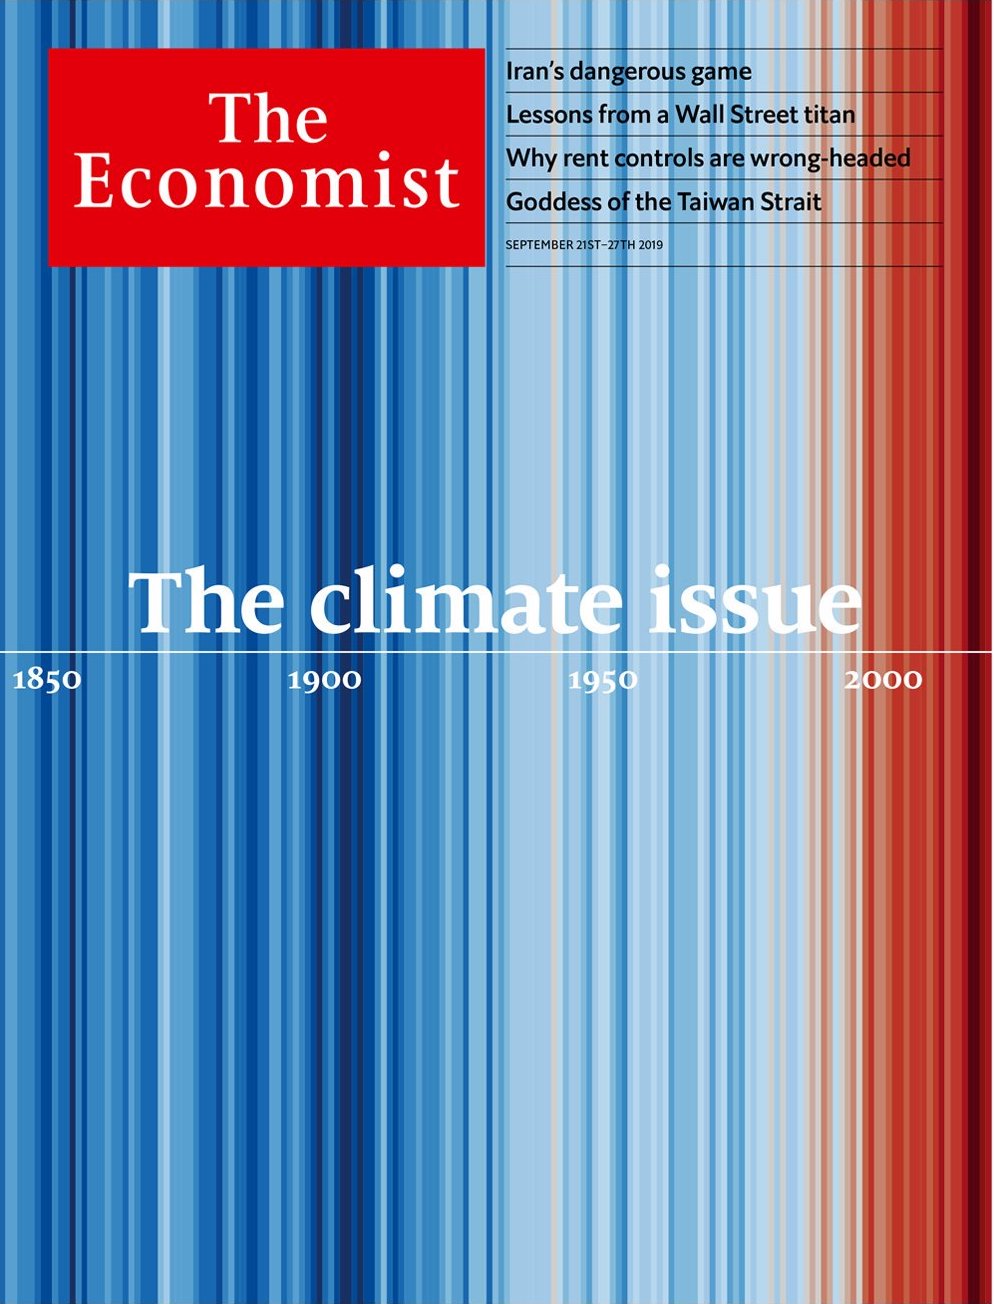
We have climate scientist Ed Hawkins on the show to talk about climate visualization. Ed is the person behind the famous spiral and stripe visualizations (see the images below). On the show we talk about how he created these visualizations and what was the impetus behind them. We also talk about breaking data visualization “rules”; climate visualization work from the visualization community; making climate information more local and more personal; and how to collaborate with climate scientists (see in the links below the list of climate scientists who are active on Twitter!).
Links
- Ed Hawkins
- Ed’s blog
- List of climate scientists active on Twitter
- Climate Spiral
- Warming Stripes
- Robert Kosara’s youtube channel