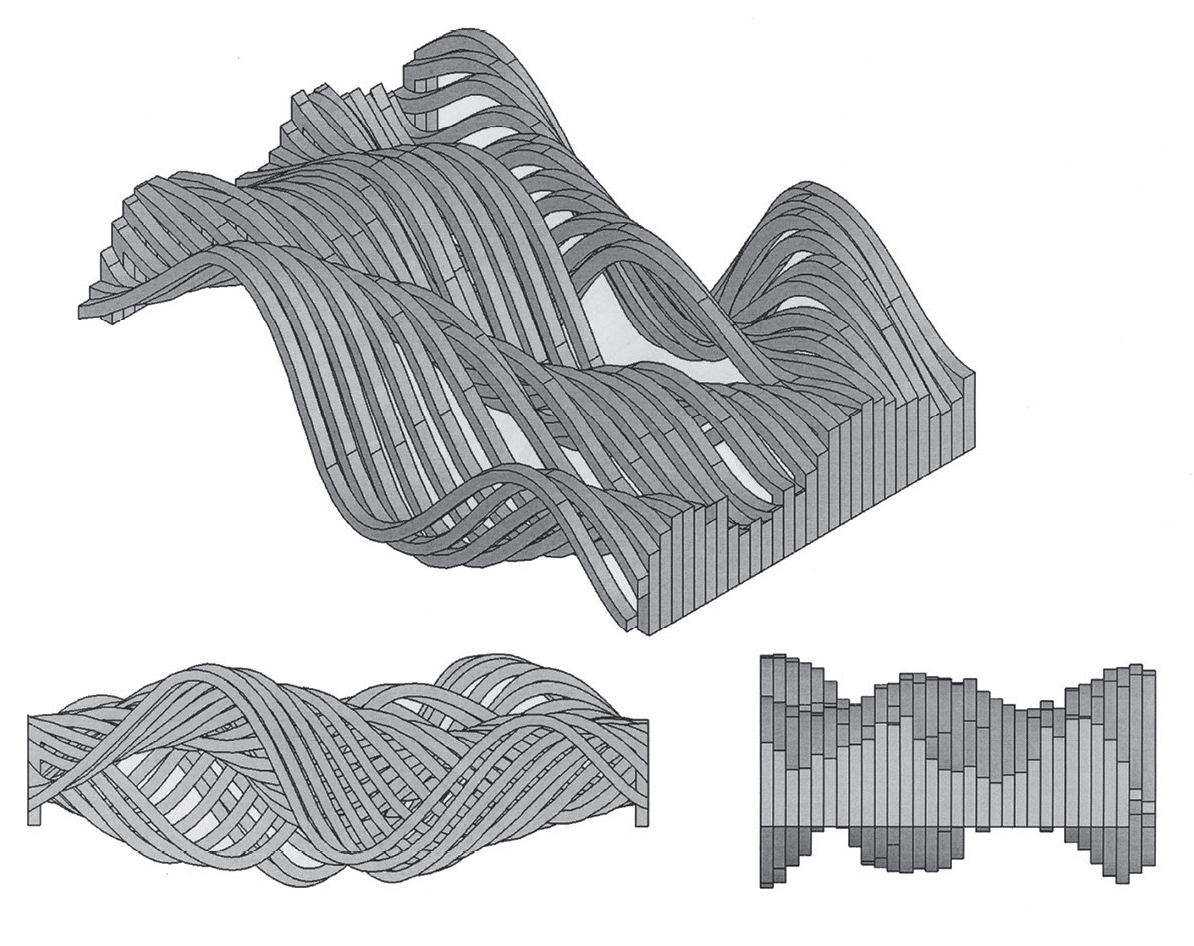
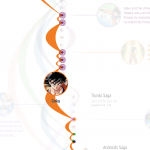
In this episode, we have artist and sculptor Adrien Segal on the show to talk about her beautiful, thoughtful, and engaging data sculptures.
Adrien is based in Oakland, California. Her work has been exhibited internationally in galleries and museums around the world.
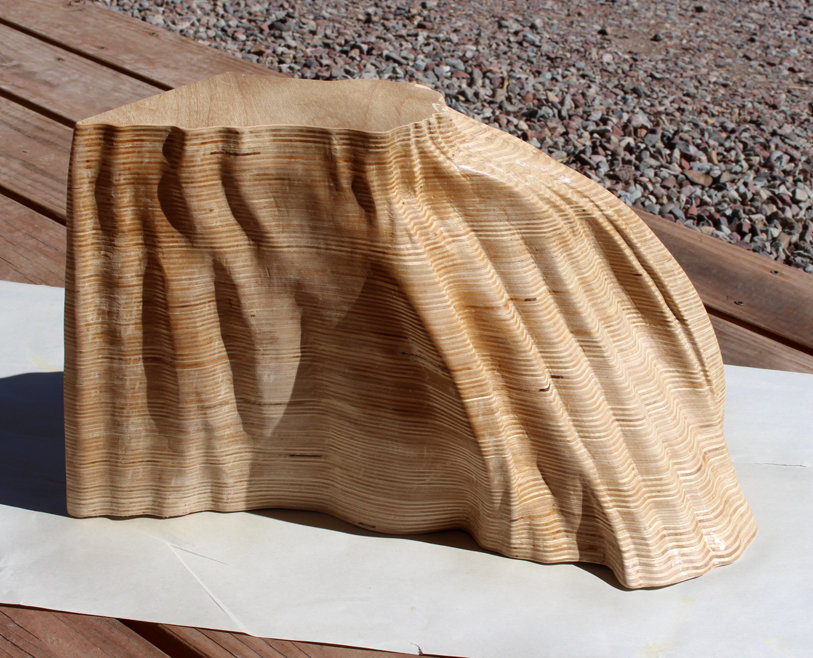
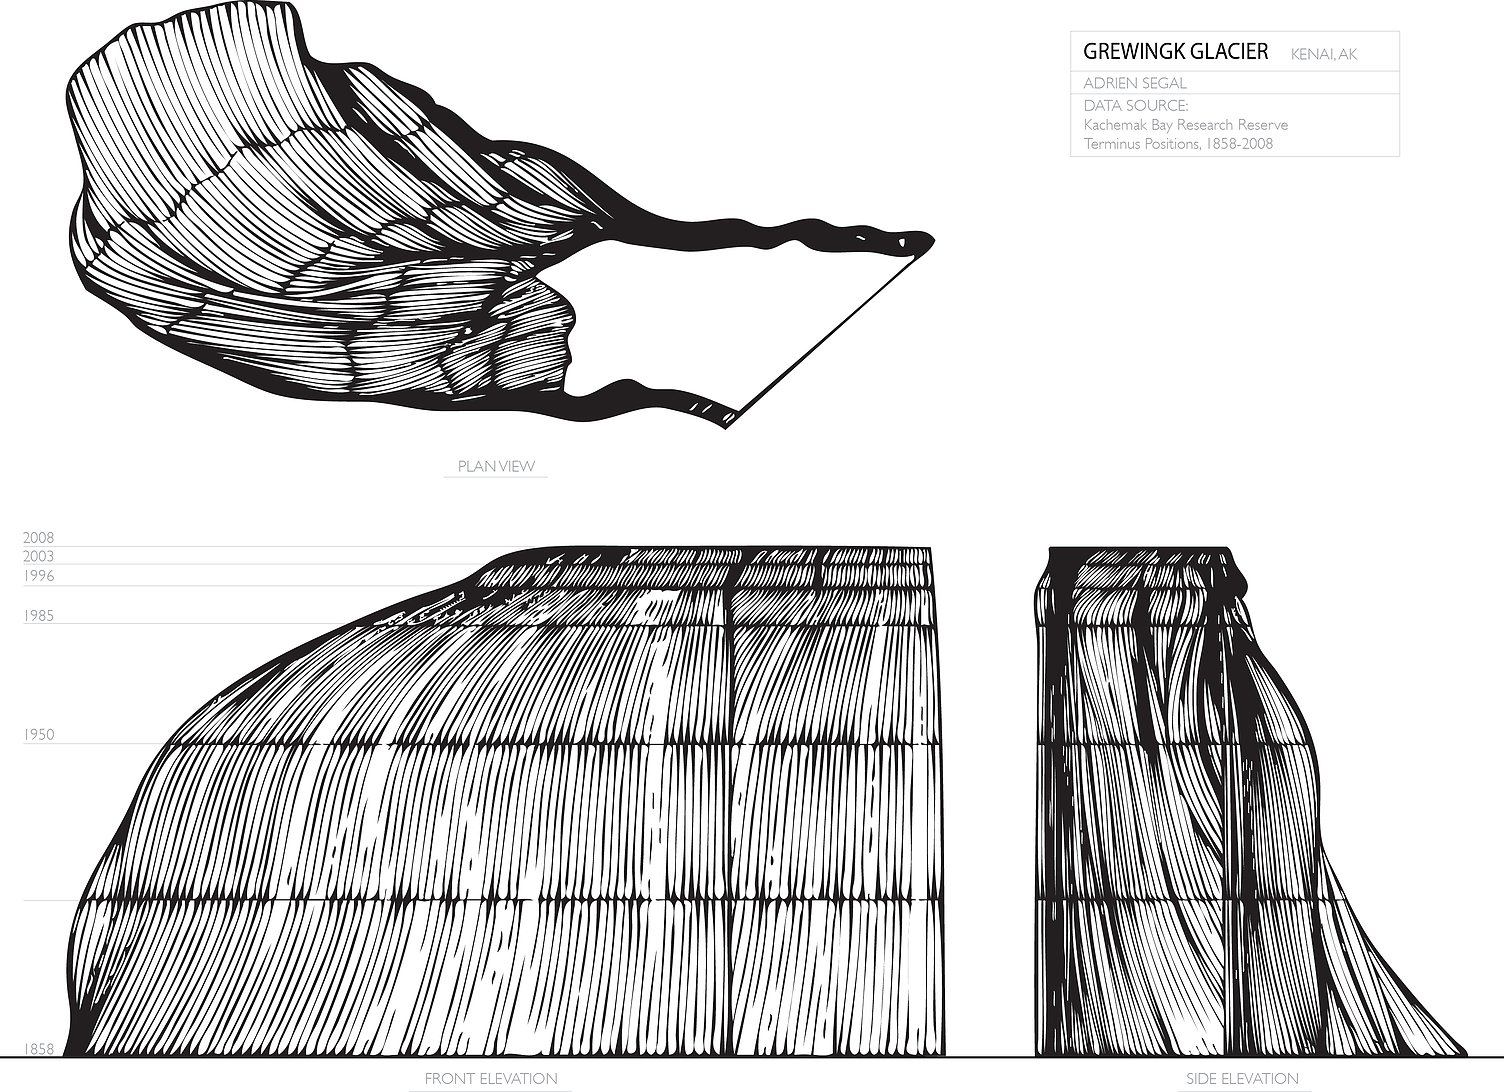
On the show, we talk about some her great artwork, including Tidal Datum, which depicts tidal charts from the National Oceanic and Atmospheric Administration (NOAA), and Grewingk Glacier, an ice sculpture depicting “the shape of the terminus of Grewingk Glacier as it has receded over 150 years time.”
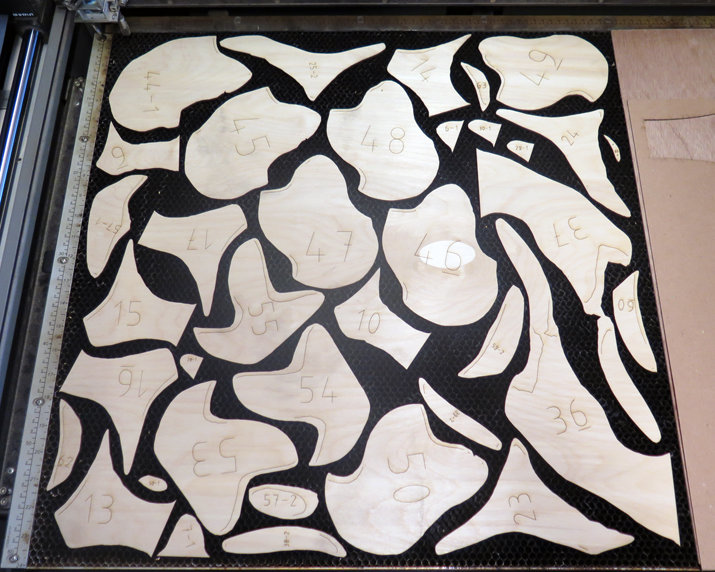
We also talk about the process Adrien follows for her sculpture production, her thinking about work in physical versus digital materials, the boundaries between art and science, and how listeners might experiment with their own data sculptures!
Enjoy the show!
A minor correction to the show: It takes 29 days for the moon to go around the Earth, not the Sun.
Data Stories is brought to you by Qlik. Are you missing out on meaningful relationships hidden in your data? Unlock the whole story with Qlik Sense through personalized visualizations and dynamic dashboards which you can download for free at qlik.de/datastories.
In this episode Moritz meets Nadieh Bremer and Shirley Wu for a face-to-face episode in Berlin.
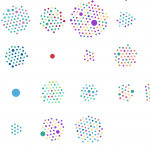
Nadieh and Shirley recently paired up to create Data Sketches, a twelve-month collaboration. Each month they choose a topic and develop a visualization on their theme.
One nice aspect of the project is that they keep track of their entire development process, including the steps they followed to prepare the data, sketch the ideas, and create the final visualizations.
On the show we talk about the organization of the projects, some favorite visualizations from the year, the partnership between the collaborators, and how they balance Data Sketches with their freelancing work.
We’re collecting listener questions, ideas, and suggestions about Data Stories for our upcoming 100th episode. Leave us a message at +1-413-650-2713 and we may just feature your voice in the podcast!
Data Stories is brought to you by Qlik. Are you missing out on meaningful relationships hidden in your data? Unlock the whole story with Qlik Sense through personalized visualizations and dynamic dashboards which you can download for free at qlik.de/datastories.
Help us fund Data Stories by donating on Patreon! We’re counting on you to switch to a crowdfunding model. Please visit our Patreon page for more details!
ProPublica – Jeff Larson http://www.propublica.org
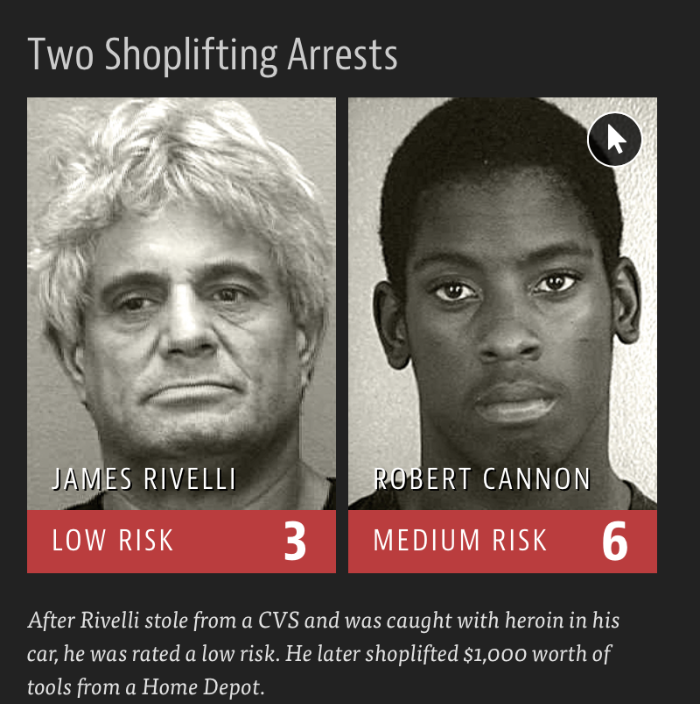
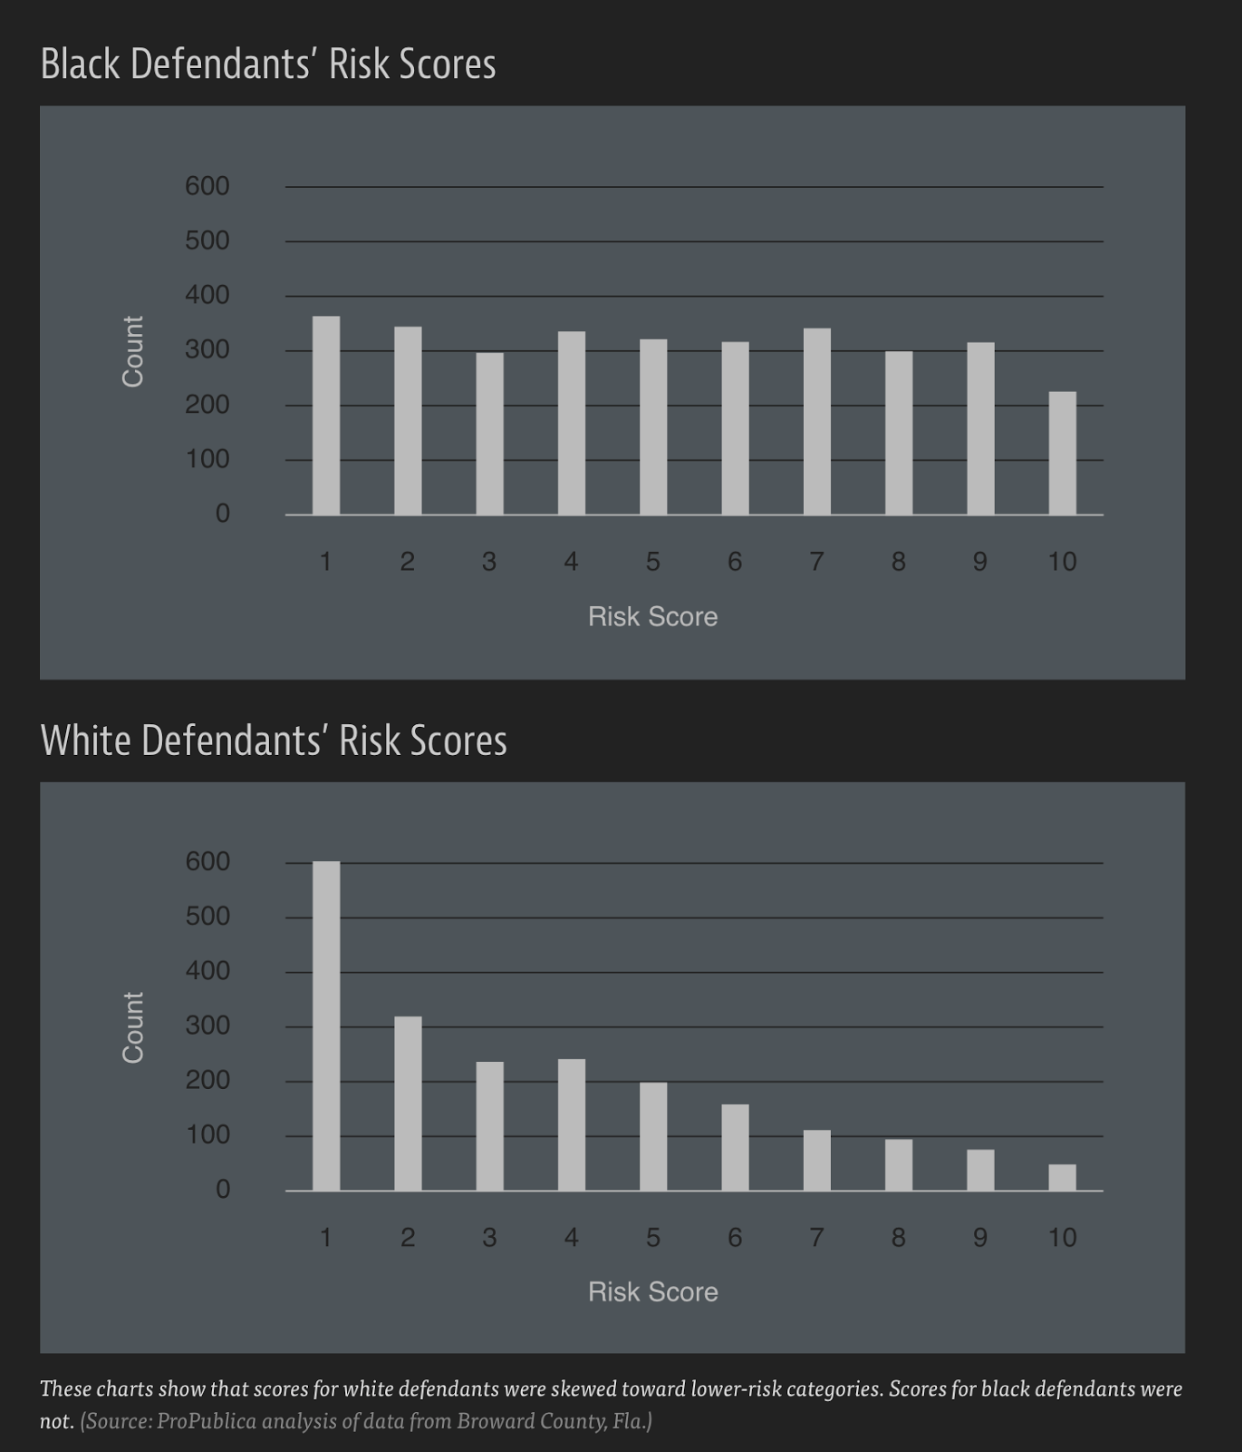
On the show this week we have Jeff Larson, Data Editor at ProPublica, to talk about his team’s recent work on “Machine Bias“. Jeff and his colleagues have analyzed the automated scoring decisions made by COMPAS, one of the systems American judges use to assess the likelihood that a convicted criminal will re-offend.
By looking at the COMPAS data, Jeff and his colleagues sought to determine the accuracy of the algorithm and whether it introduces significant biases into the criminal justice system — racial or otherwise. (Their finding: Yes, it seems that it does.)
On the show we talk about how the software is used by judges, how the ProPublica analysis was carried out, what the team found, and what can be done to improve the situation.
Jeff also gives us a small preview of other stories his team is working on and how you can go about developing similar projects.
Enjoy the show!
This episode of Data Stories is sponsored by Qlik, which allows you to explore the hidden relationships within your data that lead to meaningful insights. Take a look at their Presidential Election app to analyze the TV network coverage for every mention of both Donald Trump and Hillary Clinton. And make sure to try out Qlik Sense for free at: qlik.de/datastories.
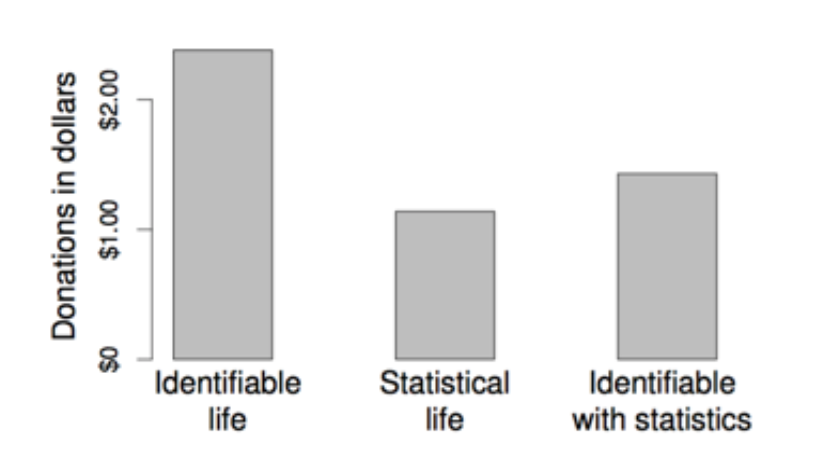
We have Professor Paul Slovic from University of Oregon on the show to talk about “Statistical Numbing.” Professor Slovic is a renowned expert on the effect of numbers and statistics on empathy (or lack thereof). His fascinating, if not depressing, experiments have consistently shown how hard it is for statistics to elicit any sense of scale in human tragedies and how numbers can often even be detrimental if the goal is to elicit compassion and generous actions from an audience.
On the show, we talk about “Statistical Numbing” and it psychological underpinnings. Professor Slovic also describes his experiments and their implications. And we address one of the most important questions: Is there hope? Is there something we, as practitioners, can do to counteract these negative effects?
Enjoy this deeply scientific episode and let us know what you think!
This episode of Data Stories is sponsored by FreshBooks, the small business accounting software that makes your accounting tasks easy, fast and secure. FreshBooks is offering a month of free unrestricted use to all of our listeners. To claim your free month of FreshBooks, go to http://freshbooks.com/datastories and sign up for free without the use of a credit card. Note: Remember to enter “Data Stories” in the section titled “I heard about FreshBooks from…”
Hey yo, we have Jen Christiansen from Scientific American with us in DS#52.
Jen is art director of information graphics at Scientific American magazine where she is been for about then years and she has a background in natural science illustration from the University of California, Santa Cruz.
Science communication is one of our favorite topics and we are so happy to have such an amazing expert like Jen on the show. Jen reveals the nitty gritty of scientific visualization and illustration as experienced by one of the top scientific communication magazines in the world.
“How does a scientific piece come to life? Where does an idea for a new piece come from? How do they interact with the scientists to make sure everything they report is accurate and yet accessible for a broad audience? And what does need to be done before an illustration gets ready for print?”
We discuss this and many other questions with Jen. Enjoy the show!
Here is another great episode … honestly I think it’s one of the best we have ever recorded (-Enrico). We talk about color, and color – you know … it’s huge. To get some help we invited Gregor Aisch from Driven By Data and asked him to talk about his experience with color and his super useful library chroma.js.
We have to apologize for a number of things. The episode came out late, the quality is not super high and we have no transcribed chapters this time. No worries, this won’t happen again (or too often) and we have no intention to neglect DS. Moritz has been traveling and taking days off in beautiful Greece and Enrico was just having another baby.
Update: Useful color tools suggested by some of you
http://www.colourlovers.com/
http://kuler.adobe.com/ (love this!)
http://colorusage.arc.nasa.gov/ColorTool.php
Update: Here is the chapter list! We just could not let such a great episode go without proper chapter marks…
[00:00] Intro: Today with Gregor Aisch from http://driven-by-data.net
[02:04] Computational Visualistics
[03:32] Today’s topic: Color
[03:46] Family drama interlude
[04:08] Colors: Powerful, but tricky to get right
[04:50] Color perception
[09:55] Color spaces
[15:39] Colors for categorical data
[17:20] What’s the maximum number of categorical colors to be used?
[19:40] Equidistance
[20:15] Colorbrewer
[23:13] chrome.js
[25:56] Colors for continuous data
[26:41] Mo’s six word advice
[27:04] Color for continuous data – usually not advisable
[30:14] Rainbow scales
[30:48] …and how to avoid them
[33:17] Color is difficult
[35:07] More tips on how to do it right
[37:29] Is there a method behind ugly visualization in science?
[38:58] Paper: Evaluation of artery visualizations
[42:39] How to deal with skewed distributions
[46:19] Learn about the data, highlight the interesting insights
[48:12] Redundant encoding and interaction between visual variables
[51:13] Use for secondary dimensions, or small number of categories
[52:57] Mo’s tips
[54:04] Don’t forget the legend
[54:34] Gregor’s tips
[56:07] Above all, do no harm.
[56:43] Enrico’s tips
[58:27] Wrapping it up
And stay tuned for another episode soon! We will have Jeff Heer on board! If you have any questions for him add a comment below or send us an email (see address in the right).

 In this episode, we have artist and sculptor Adrien Segal on the show to talk about her beautiful, thoughtful, and engaging data sculptures.


 In this episode Moritz meets


 We have