Kim is a visualization researcher and information designer. He currently works at the Center for Complex Network Research, the lab led by famous network physicist László Barabási.
Kim works in a team of scientists to create effective and beautiful visualizations that explain complex scientific phenomena.
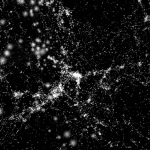
In the show we focus on Untangling Tennis, a data visualization project aimed at explaining the relationship between popularity and athletic performance. We also talk about his more recent project, the Cosmic Web, which visualizes 24,000 galaxies and their network of gravitational relationships.
Enjoy the show!
This episode of Data Stories is sponsored by Qlik, which allows you to explore the hidden relationships within your data that lead to meaningful insights. Make sure to check out the blog post listing Visualization Advocate Patrik Lundblad’s favorite data visualization pioneers. You can try out Qlik Sense for free at qlik.de/datastories.
LINKS
- Kim Albrecht
- Untangling Tennis
- The Cosmic Web
- D3.js
- three.js, a javascript library for 3D vis
- Ben Shneiderman’s The New ABC of Research
- Peter Galison‘s Image and Logic
- Peter Galison’s “Images Scatter Into Data, Data Gathers Into Images”


