Hey folks, we are back!
Before delving into this episode’s content, we have a special announcement: we started a crowdfunding campaign to turn Data Stories into a show that is fully-funded by our listeners! You can support us by visiting our Patreon page, and all the details of the initiative can be found here.

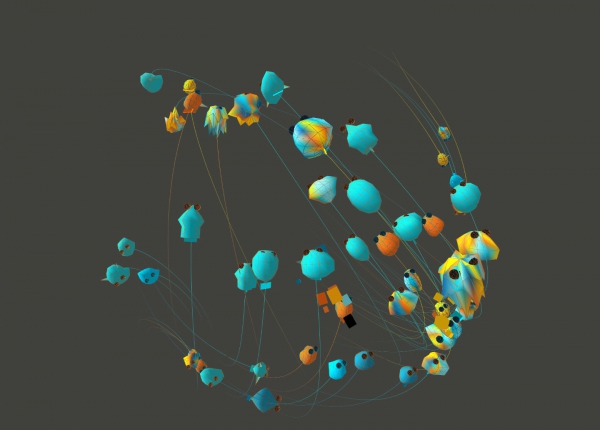
For our first episode of 2017 we had a very delightful chat with Brendan Dawes. Brendan is an artist and designer who works with interactive installations, data visualizations, and all things across the digital and physical sphere. He has a lot of super fascinating projects, including the famous Cinema Redux, an art piece that visualizes entire movies as a collection of snapshots.
On the show we talk about his projects, his design process and philosophy, his relationship with the data visualization world, how he generates ideas, and his upcoming projects.
We hope you enjoy this great conversation at the intersection of data, art, design, interaction and visualization!
Data Stories is brought to you by Qlik. Are you missing out on meaningful relationships hidden in your data? Unlock the whole story with Qlik Sense through personalized visualizations and dynamic dashboards which you can download for free at qlik.de/datastories.


Links
- Our Patreon crowdfunding campaign: https://www.patreon.com/datastories
- Brendan Dawes: http://www.brendandawes.com/
- Brendan’s Cinema Redux project: http://www.brendandawes.com/projects/cinemaredux
- Our episode on Indexical Visualization: http://datastori.es/80-indexical-visualization-with-dietmar-offenhuber/
- Brendan’s Doris Le Bot project: http://www.brendandawes.com/projects/dorislebot
- Brendan’s James Bond Kills project: http://www.brendandawes.com/projects/jamesbondkills
- Brendan’s Plastic Player project: http://www.brendandawes.com/projects/plasticplayer
- Brendan’s Six Monkeys project for email interaction: http://www.brendandawes.com/projects/sixmonkeys
- Processing software: https://processing.org/
- openFrameworks: http://openframeworks.cc/
Help Data Stories get crowdfunded! You can find the details at our Patreon page: https://www.patreon.com/datastories.