We have a nice trio on the show for this episode: Jeremy Boy is a postdoctoral researcher at NYU School of Engineering, Helen Kennedy is Professor of Digital Society at University of Sheffield, and Andy Kirk is our beloved editor at visualisingdata.com.


We talk with these three experts about Data Visualization Literacy — that is, how people read data visualizations. We ask, how do we measure literacy? How do we improve it? And how do we even define literacy when we’re asking our viewers to read images?
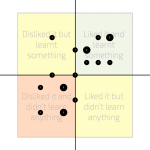
Jeremy talks about his research on methods to measure visualization literacy, while Helen and Andy discuss their Seeing Data project, which studies how people read visualizations.
If you prefer reading to listening, you can find the transcript of our episode here. Enjoy the show!
Data Stories is brought to you by Qlik, which allows you to explore the hidden relationships within your data that lead to meaningful insights. Let your instincts lead the way to create personalized visualizations and dynamic dashboards with Qlik Sense. Download Qlik Sense for free at www.qlik.de/datastories. This week, the Qlik blog features a great post on maps and the data literacy required to read them called “Here Be Dragons.”
LINKS
- Andy Kirk: visualisingdata.com
- Helen Kennedy: http://www.sheffield.ac.uk/socstudies/staff/staff-profiles/helen-kennedy
- Jeremy Boy: http://jyby.eu/
- Seeing Data Project: http://seeingdata.org
Seeing Data Results:
- http://www.visualisingdata.com/2015/10/views-from-seeing-data-research-part-1/
- http://www.visualisingdata.com/2015/12/views-from-seeing-data-research-part-2/
- http://www.visualisingdata.com/2016/02/views-from-seeing-data-research-part-3/
- Three funded PhD Studentships at University of Sheffield: http://www.sheffield.ac.uk/socstudies/prospt/ppr/scholarships/datanetwork
Some research papers on data visualization literacy:
- Boy, Jeremy, et al. “A principled way of assessing visualization literacy.“Visualization and Computer Graphics, IEEE Transactions on 20.12 (2014): 1963-1972.
- Lee, Sukwon, et al. “How do People Make Sense of Unfamiliar Visualizations?: A Grounded Model of Novice’s Information Visualization Sensemaking.” Visualization and Computer Graphics, IEEE Transactions on 22.1 (2016): 499-508.
- Börner, Katy, et al. “Investigating aspects of data visualization literacy using 20 information visualizations and 273 science museum visitors.” Information Visualization (2015): 1473871615594652.
Some other interesting projects:
- Vis Literacy Workshop (at InfoVis): http://visualizationliteracy.org/workshop
- Vis Literacy at Purdue: https://engineering.purdue.edu/HIVELab/wiki/pmwiki.php/VisualizationLiteracy
- Vis Literacy Workshop (at EuroVis): https://www.kth.se/profile/178785/page/eurovis-2014-workshop-towards-visualiza/