 On the show this week, we have Andy Kriebel, Head Coach at The Information Lab, and Andy Cotgreave, Technical Evangelist at Tableau, to talk about their lovely social web series, #MakeoverMonday.
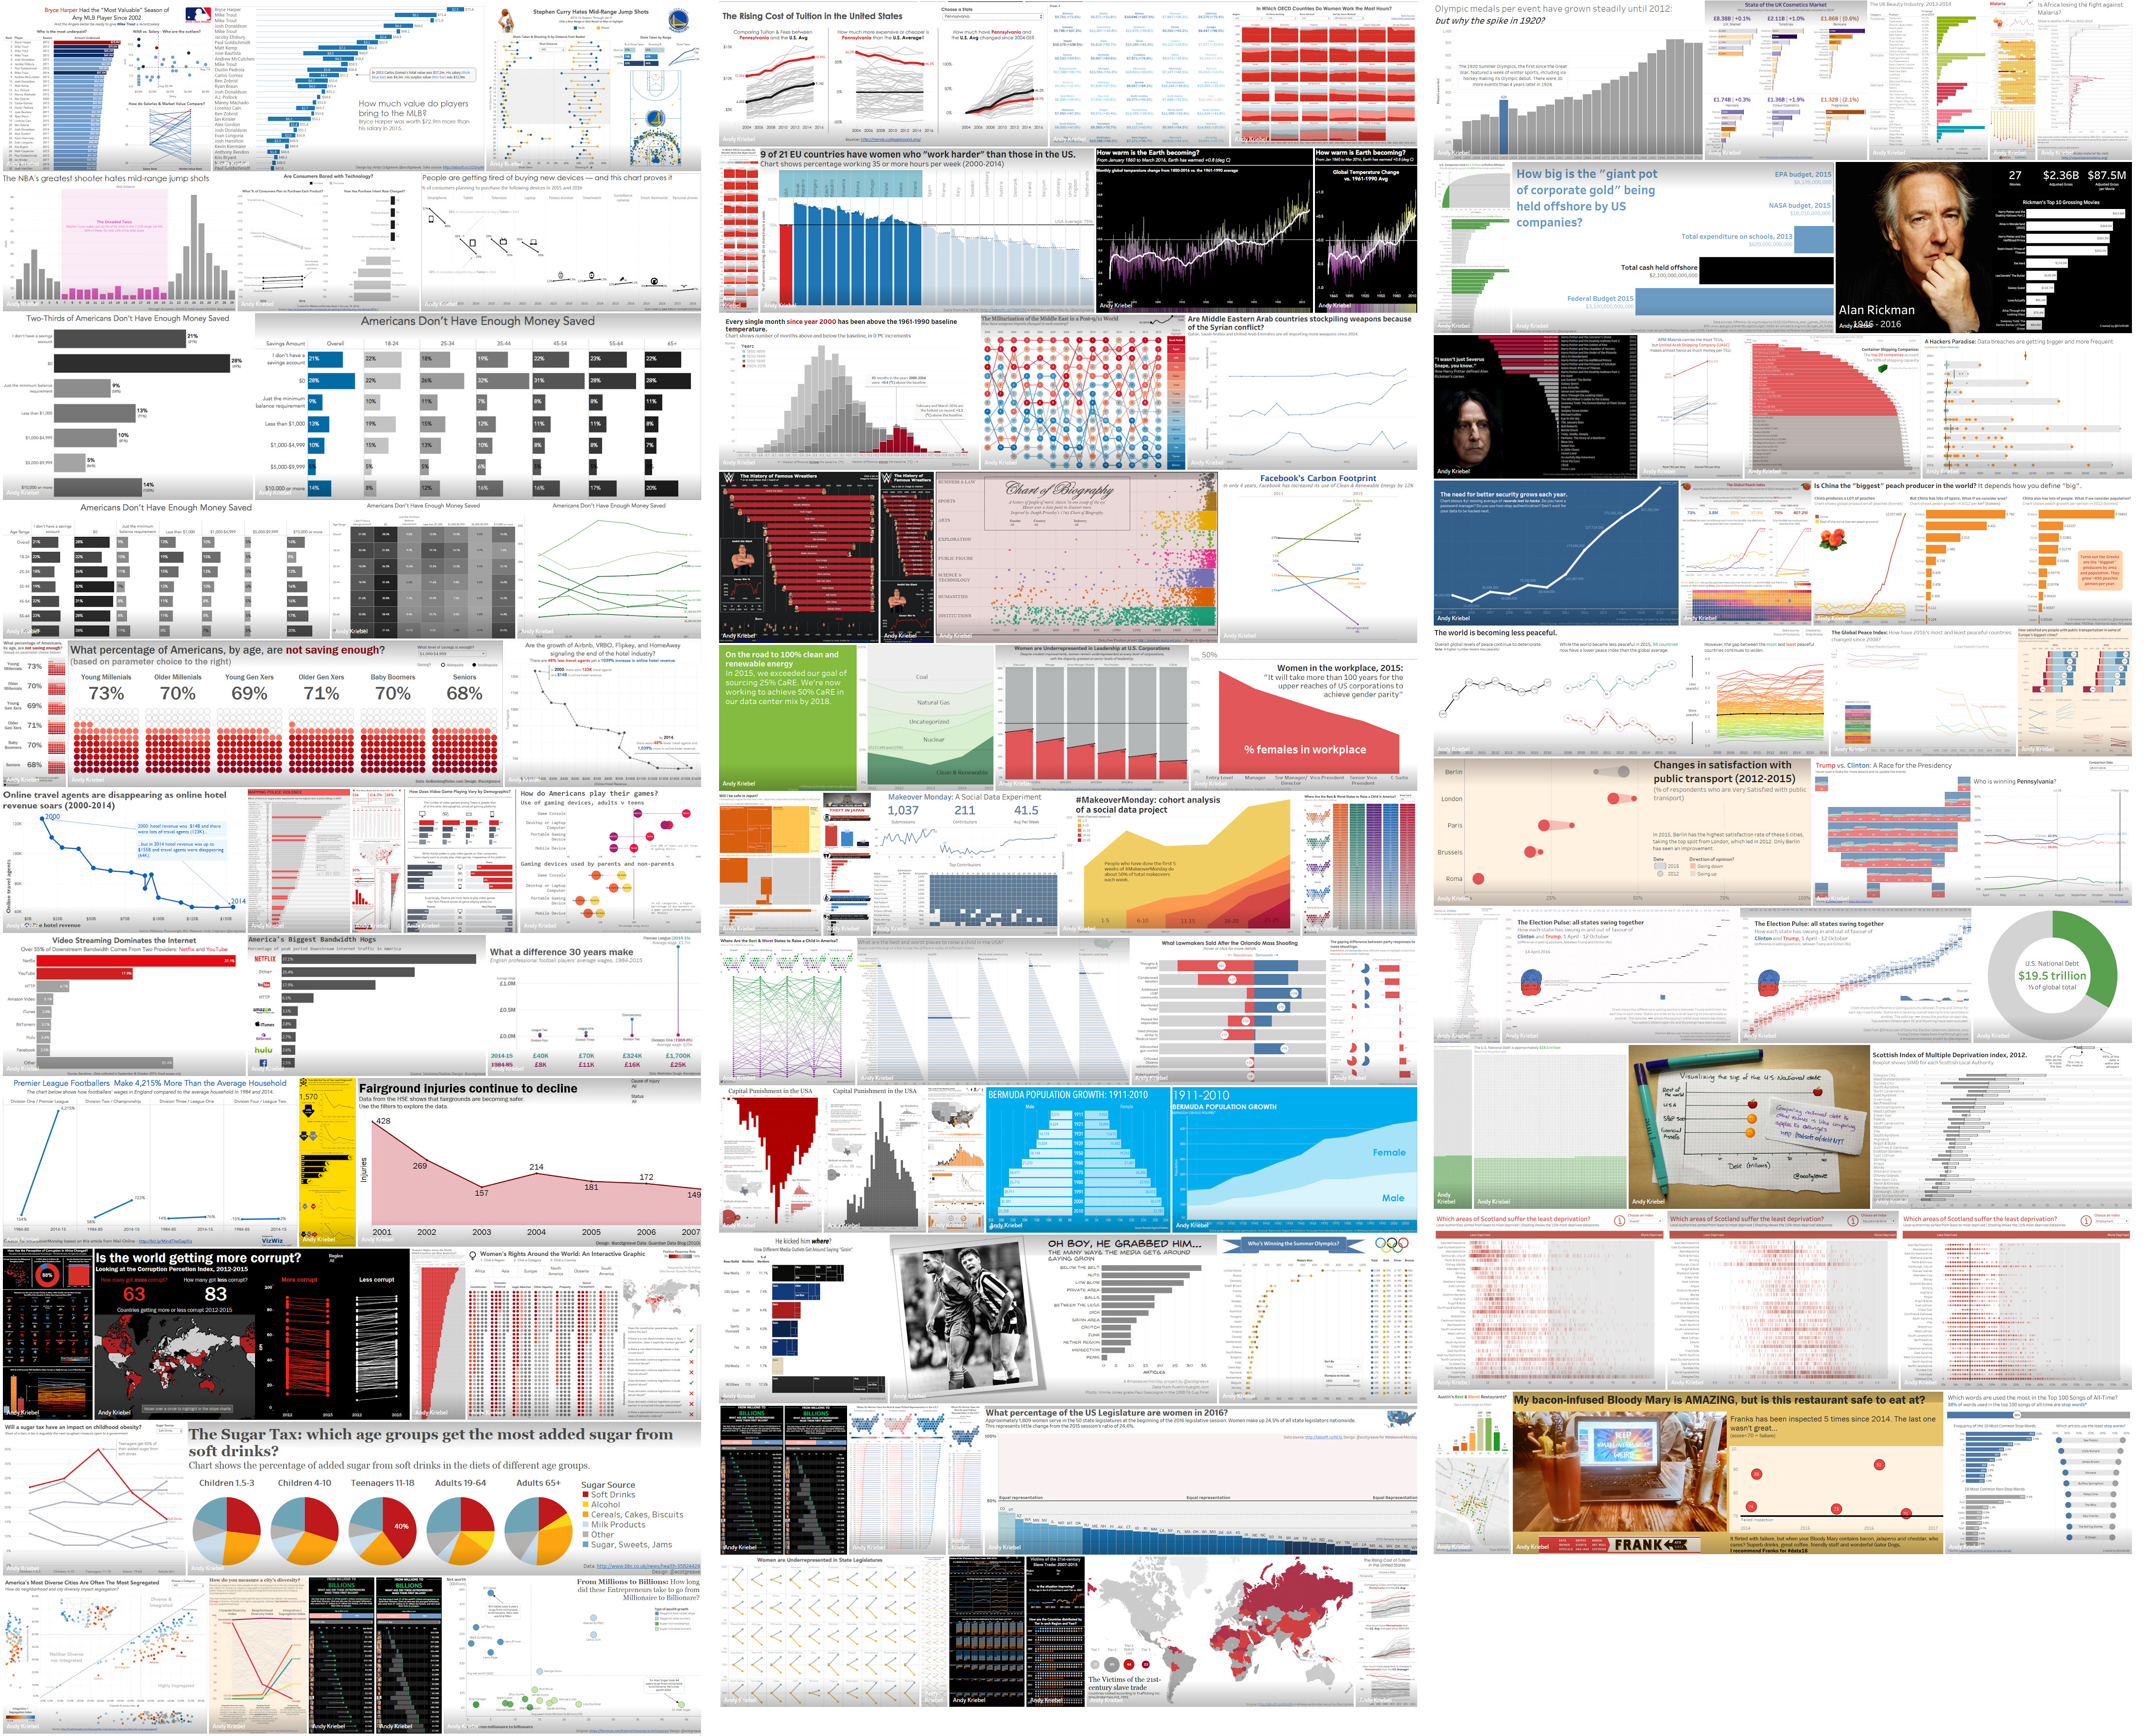
This is how #MakeoverMonday works, according to Andy and Andy: “Each week we post a link to a chart, and its data, and then you rework the chart. Maybe you retell the story more effectively, or find a new story in the data. We’re curious to see the different approaches you all take. Whether it’s a simple bar chart or an elaborate infographic, we encourage everyone of all skills to partake. Together we can have broader conversations about and with data.”
The series has recently gained a lot of traction: they have seen more than 2,800 entries from 470 participants, and will soon complete a whole set of entries for the year.
On the show we talk about how they got started with the project, how the series works, some interesting solutions they have received, and what is coming next.
Enjoy the show!
Links
- Rhythm of Food
- Andy Cotgreave: http://gravyanecdote.com
- Andy Kriebel: http://www.vizwiz.com
- MakeoverMonday: http://www.makeovermonday.co.uk
- The Makeover Monday Pinterest Board: https://www.pinterest.com/andykriebel/makeover-monday/
- Don Norman’s The Design of Everyday Things book
- The big Makeover Monday story on climate change
- Fernanda Viégas and Martin Wattenberg on Design and Redesign in Data Visualization
This episode of Data Stories is sponsored by the Centre for Interdisciplinary Methodologies at the University of Warwick, where students study masters courses in Urban Informatics and Analytics, Big Data and Digital Media. These courses include subjects such as Visualisation, Big Data, Digital Sociology, Advanced Quantitative Research, and Spatial Methods including Geographic Information Systems all the way to User Interface Cultures and Playful Media. Find out more about studying and working with CIM at www.warwick.ac.uk/datastories.