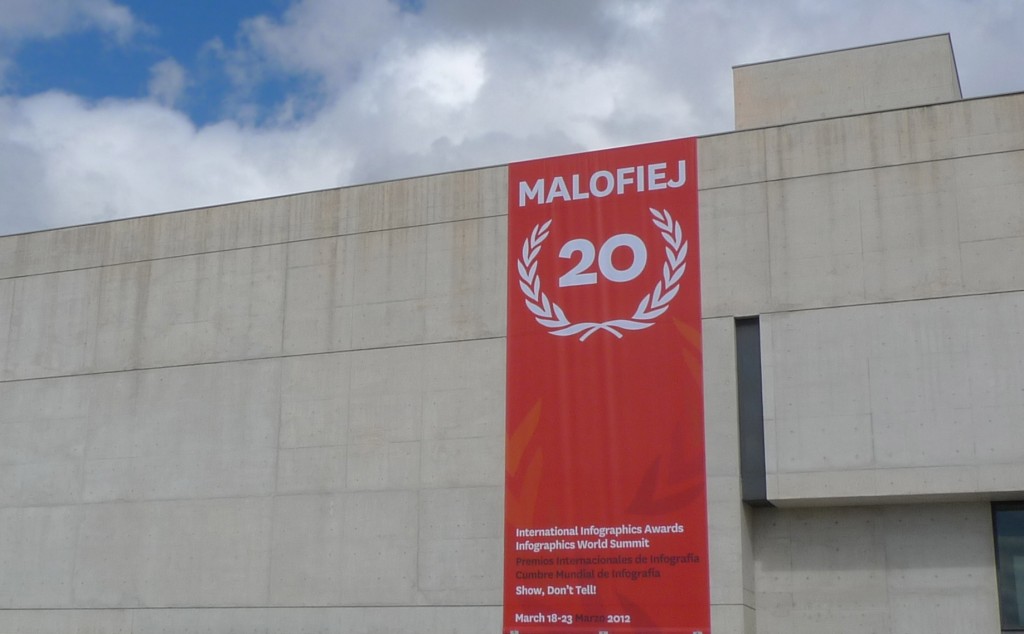
We have our first guest on the show! Andy Kirk and Moritz just came back from Malofiej 20, the Infographic World Summit, and we used the chance to discuss our impressions of the event — the conference, the awards, the workshops and the general vibe.

Breakdown of the episode
[00:00:00] Intro and welcome to our guest Andy “Not McCandless” Kirk from visualisingdata.com
[00:02:31] Malofiej: what is it, how did we there and some history
[00:07:20] Pamplona lifestyle
[00:08:42] Stockholm syndrome or best friends forever?
[00:10:08] Conference talks in short
[00:10:23] Gonzalo Peltzer
[00:12:12] Andrew Vande Moere
[00:14:02] Moritz Stefaner (slides)
[00:16:13] Andy “Big Data” Kirk (slides)
[00:23:00] Sheila Pontis
[00:25:15] Bryan Christie
[00:27:39] Simon Rogers
[00:28:47] Robert Kosara
[00:30:44] Alberto Cairo
[00:31:59] Anne Gerdes, Nora Coenenberg
[00:33:42] Nigel Holmes
[00:35:20] Matthew Bloch
[00:37:15] Ginny Mason
[00:39:14] Carl DeTorres
[00:41:34] Jaime Serra
[00:44:17] Sergio Pecanha
[00:45:50] Mario Tascon (@mtascon)
[00:46:43] The awards
Winner list (pdf)
Gold medals with Jury remarks
All online winners with links [colorful-data.net]
[00:49:49] New York Times dominates
[00:51:22] Best of show: Guantanamo Detainees
Print piece (and some background info)
Online
[00:53:49] New York Times again
[00:58:17] Internet Group do Brasil
[00:58:49] Resumé
[01:03:02] What is an information graphic, after all?
Images of the Devastation Along Misurata’s Main Road
Part Ape, Part Human
[01:05:25] We should all submit our online works
[01:06:27] We just can’t finish
The jury + speaker crowd
More on Malofiej 20


Hey guys,
I have been wanting to congratulate you since day one of your podcast but never got around to it. You guys do a great job, with interesting content and a casual atmosphere. Only downside is the frequency: any chance you can find time to do it weekly?
You mentioned a few topics I would be interested in:
– what tools to use (perhaps with separate focus on programmers and non-programmers)
– where to get training: not being from a city like New York where it appears relatively easy to find education on this topic, I’d specifically be interested in online options
– also a list of conferences that are interesting from a data visualization perspective would be great to know. There are some obvious ones, like visweek and Malofiej, but perhaps also talk about conferences that are focusing on other topics but may cover data visualization (any developers conference (Processing?), UX related, WHERE by O’Reilly, etc.). If I think of more I will let you know
– lastly mentioning online videos / webinars would be great, especially if you review them. One example would be Noah Iliinsky’s video that recently showed up on Youtube: http://www.google.ca/url?sa=t&rct=j&q=noah%20iliinsky&source=video&cd=1&ved=0CDcQtwIwAA&url=http%3A%2F%2Fwww.youtube.com%2Fwatch%3Fv%3DR-oiKt7bUU8&ei=0a-ET6TVEIaziQL14_T1BA&usg=AFQjCNHp11Npe4_qoM3MUOFxSGoplP54fg. I have yet to watch it but looking forward to spending over an hour and a half on data visualization.
Anyway, keep up the great work and looking forward to episode 5!
Cheers,
Robert
@kogeldesign
Where I listened
I wanted to respond to Andy’s request to hear about where we were when we listened to the podcast. I was walking my dog on Kite Hill in San Francisco! Since the NYTimes won so many awards at Malofiej, here is a NYTimes photo and description of Kite Hill: http://bayarea.blogs.nytimes.com/2009/10/20/vistas-kite-hill/
Many thanks for sharing Stephanie! Just seen this now, I might need to get the message out to people again or maybe its just me that’s interested…!
Hey There. I discovered your blog using msn. This is a really smartly written article.
I will be sure to bookmark it and come back to learn more of your useful info.
Thank you for the post. I’ll certainly comeback.