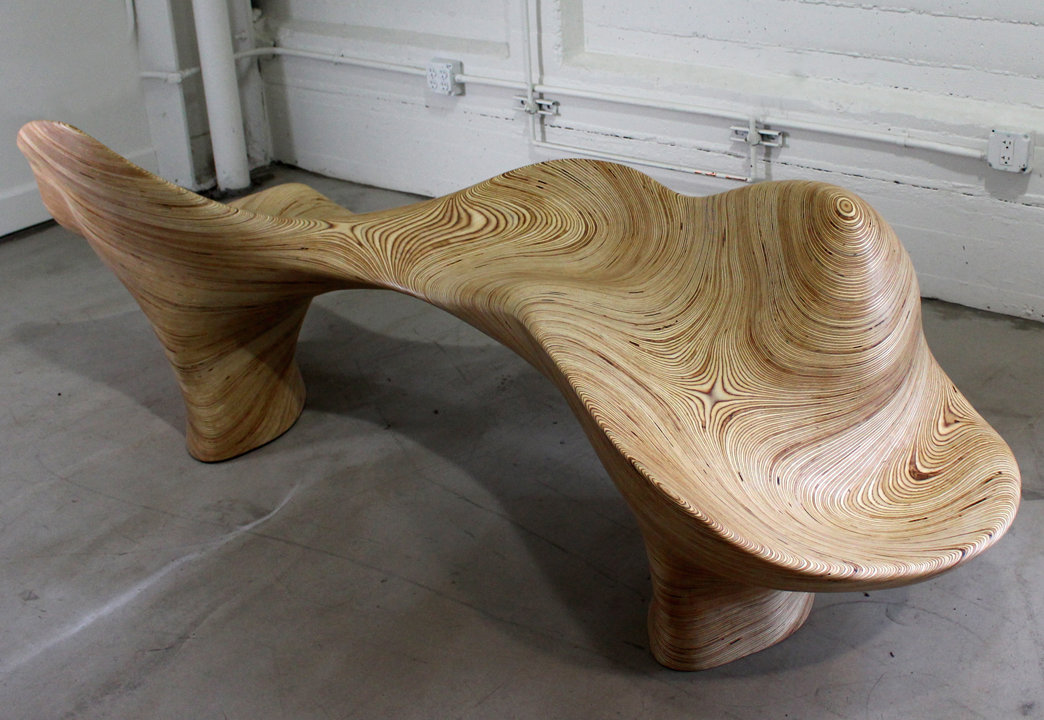
 In this episode, we have artist and sculptor Adrien Segal on the show to talk about her beautiful, thoughtful, and engaging data sculptures.
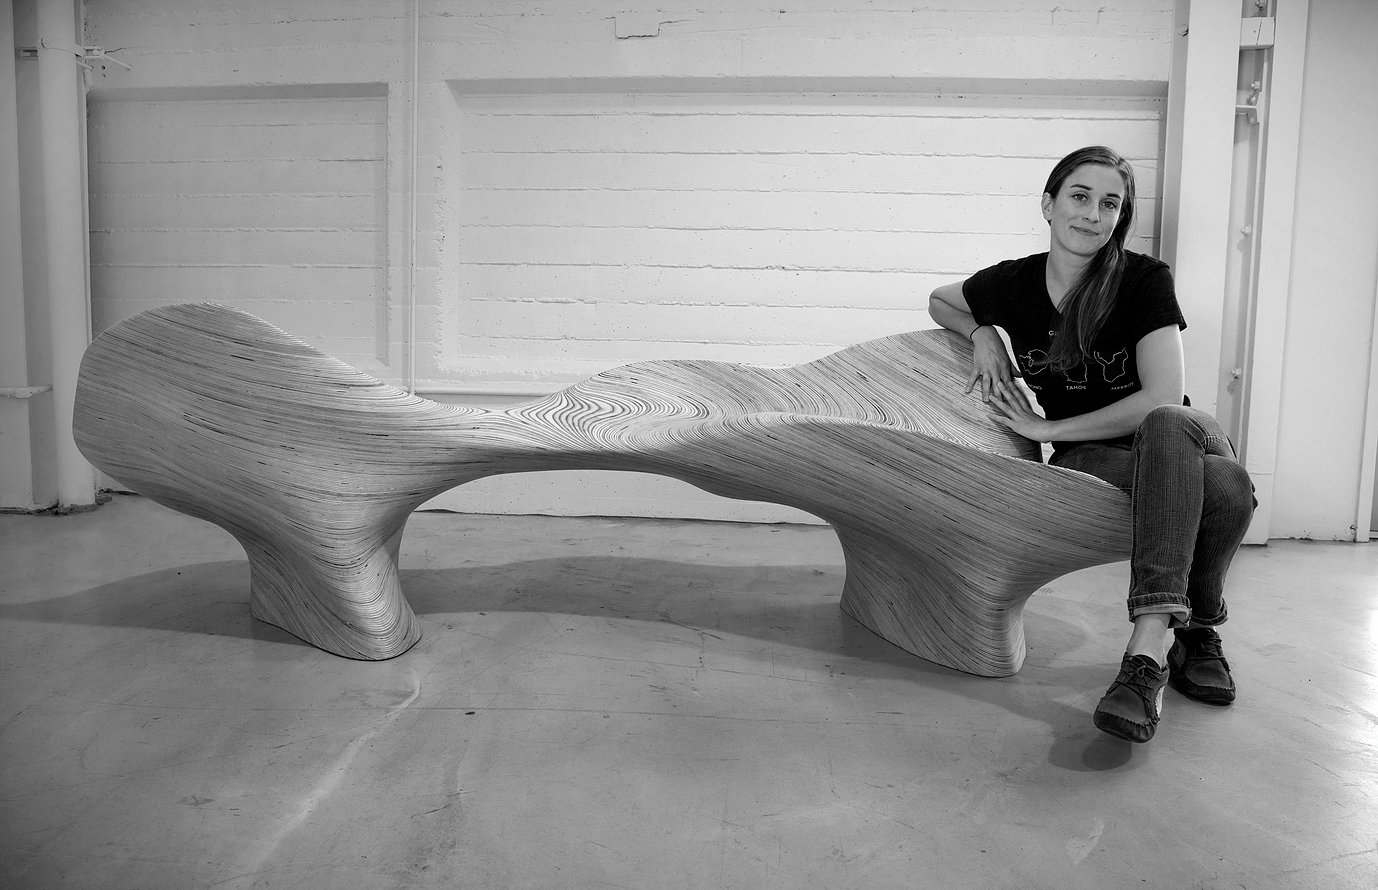
Adrien is based in Oakland, California. Her work has been exhibited internationally in galleries and museums around the world.
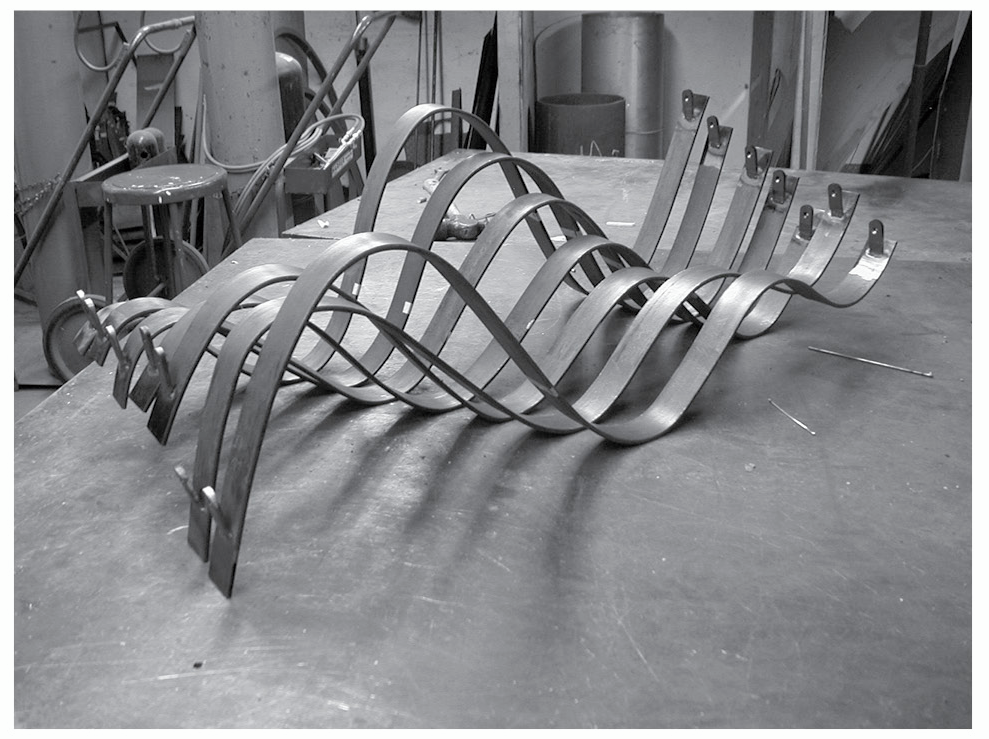
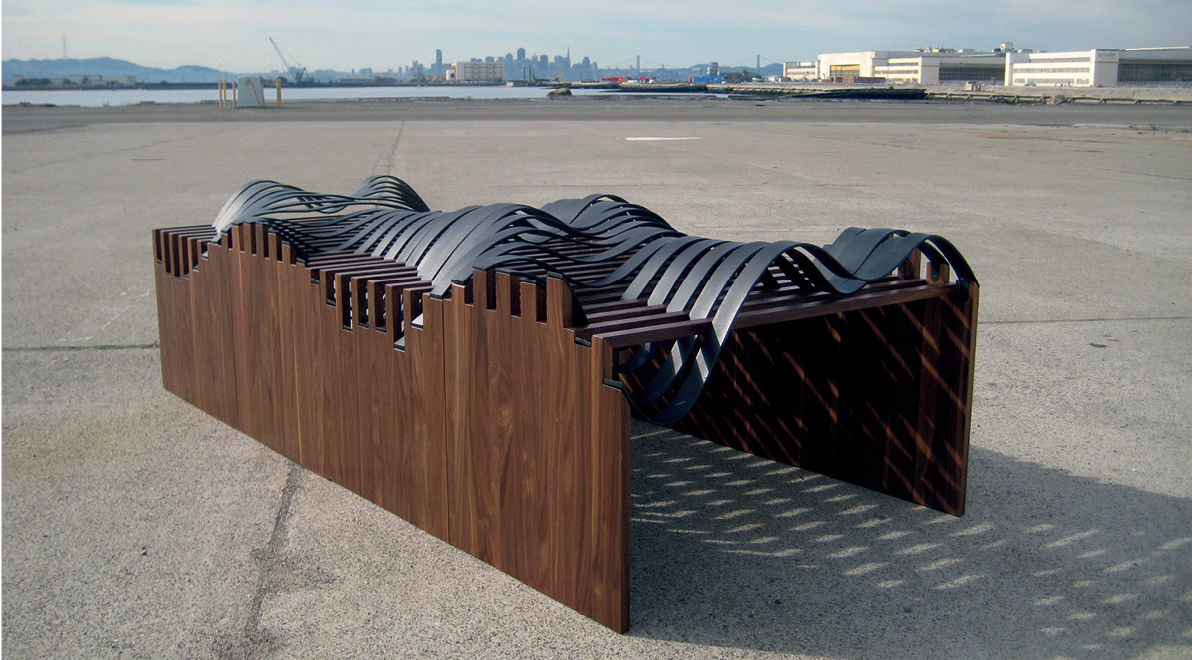
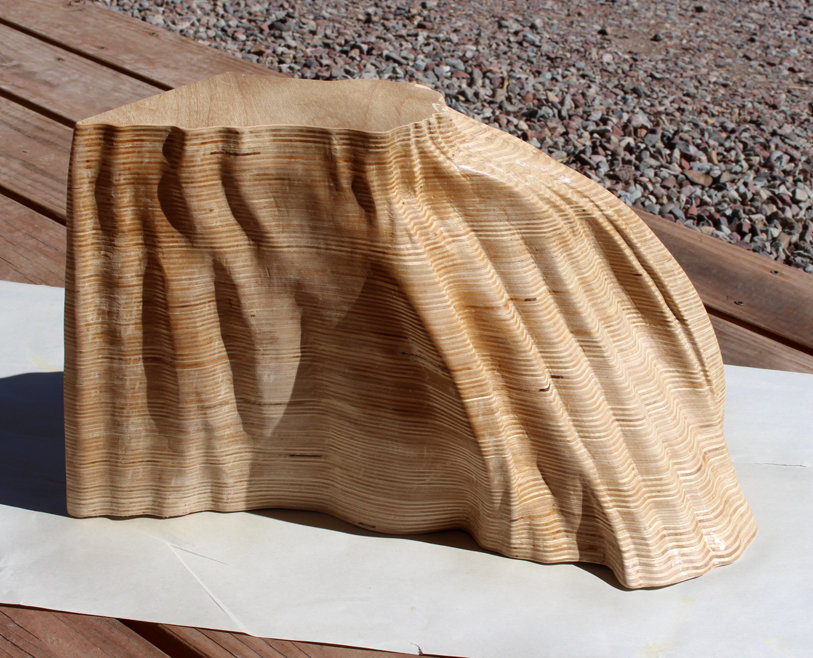
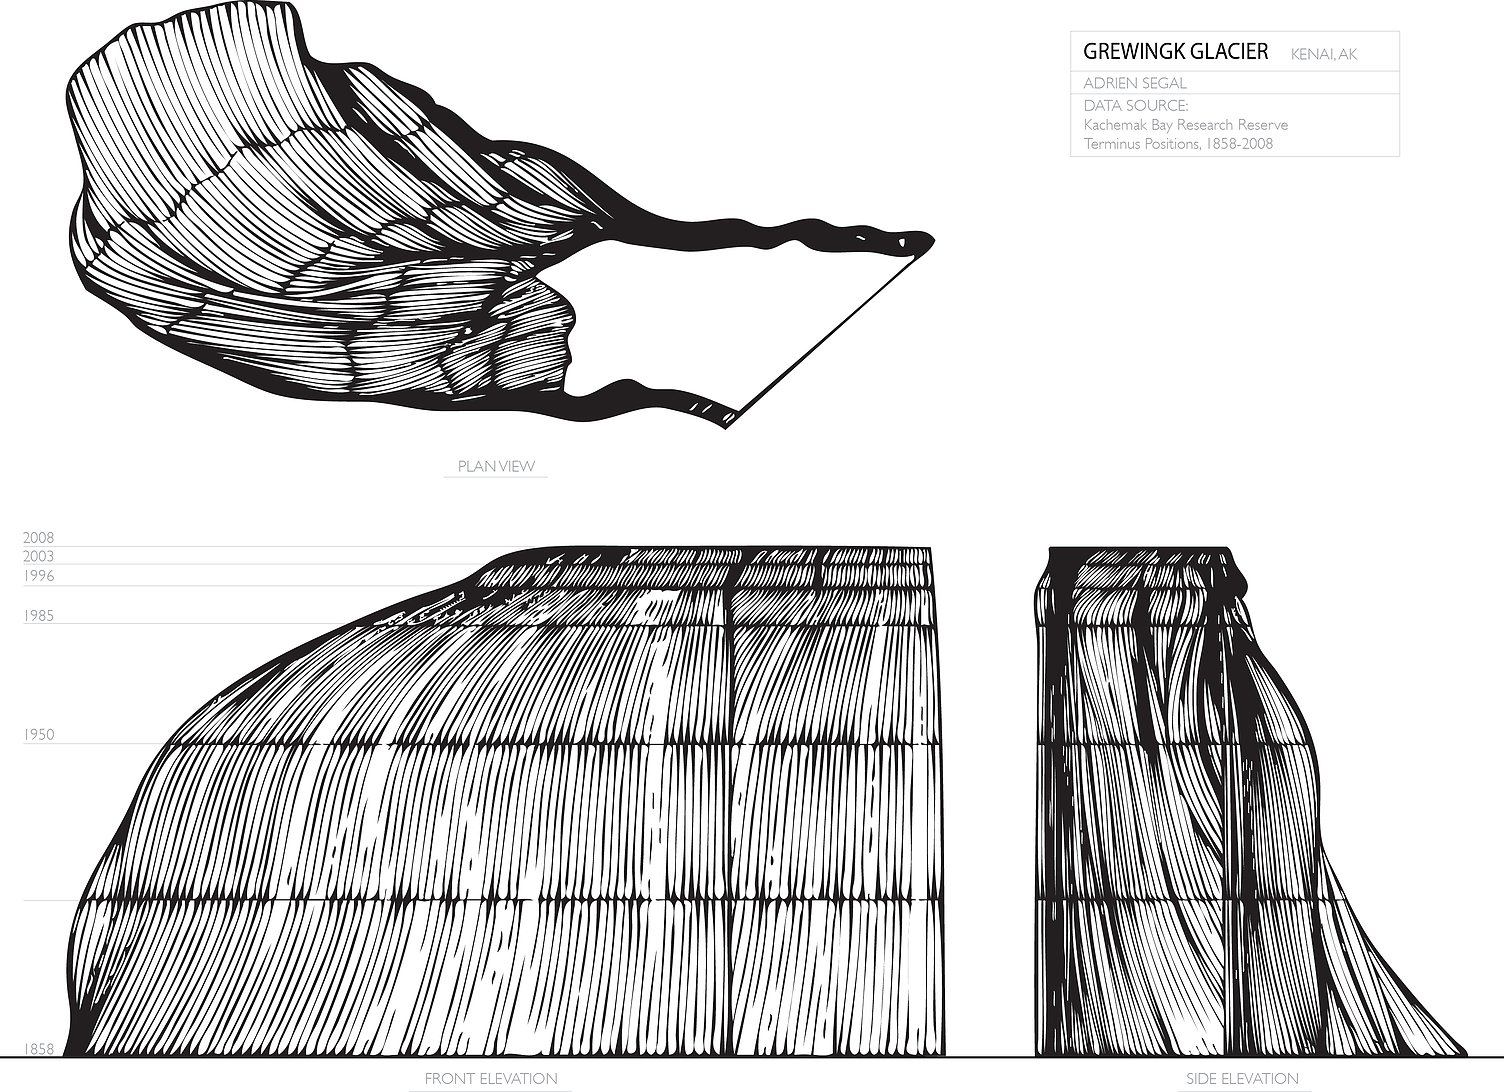
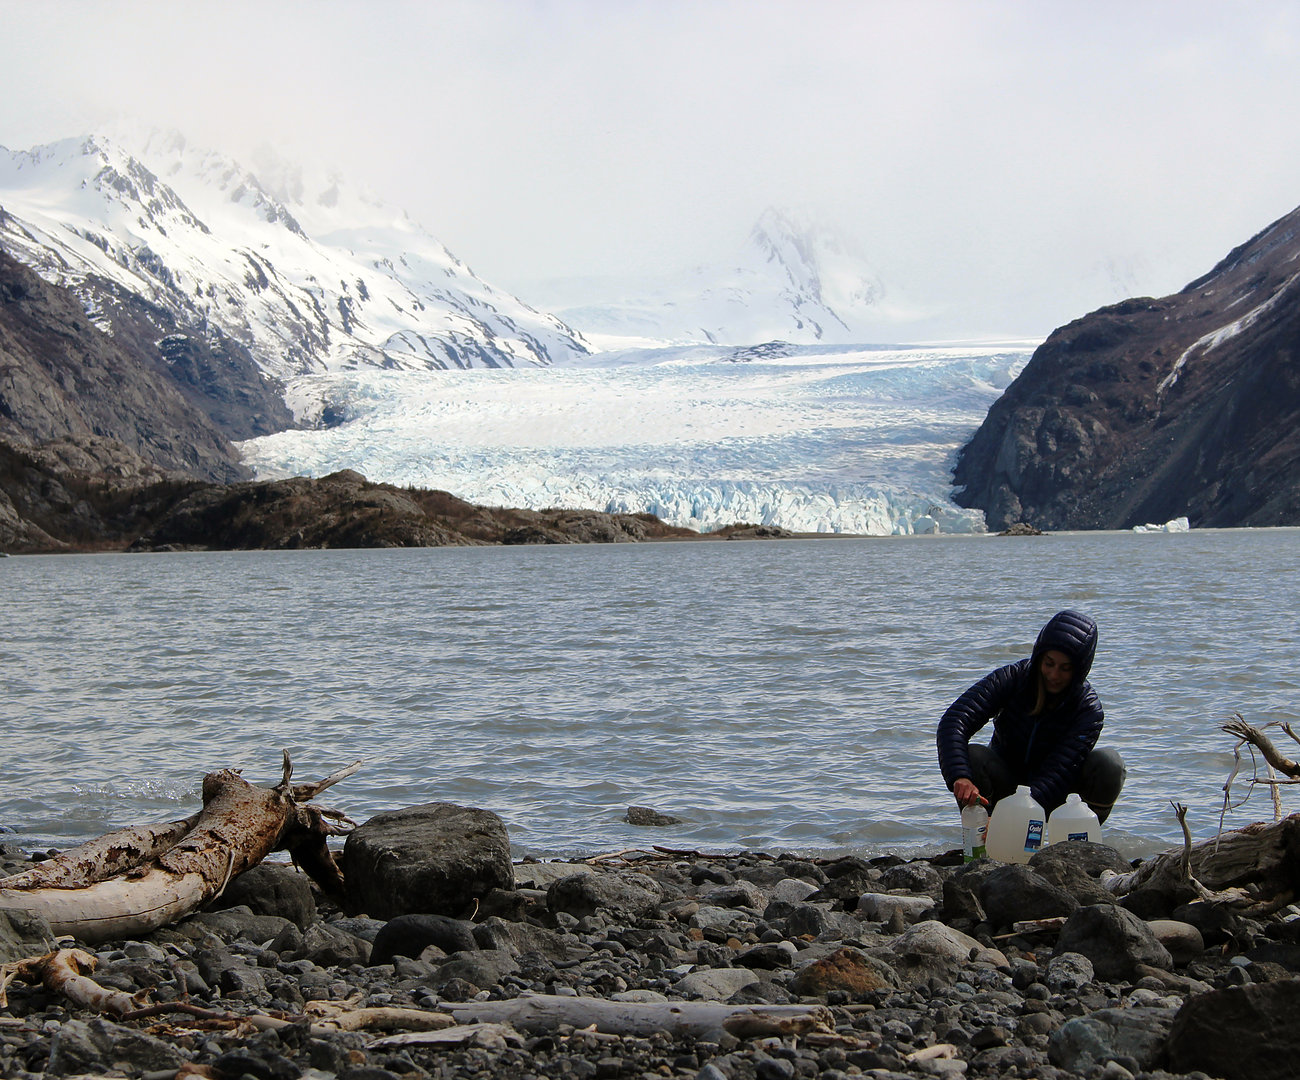
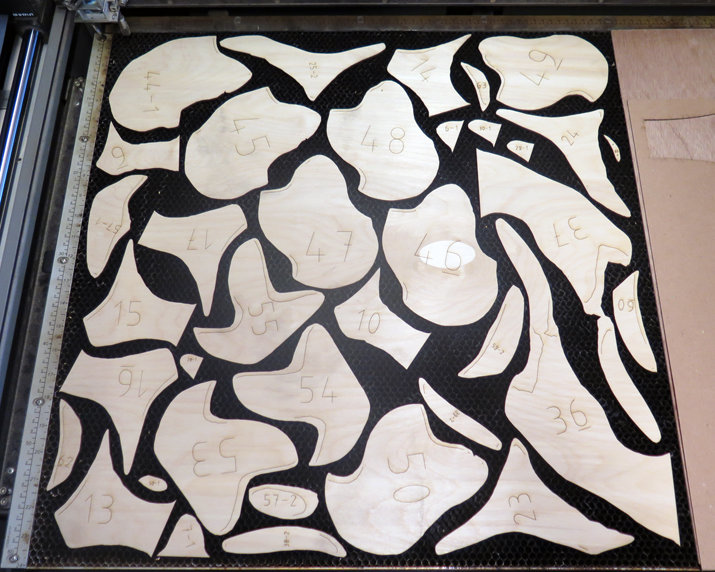
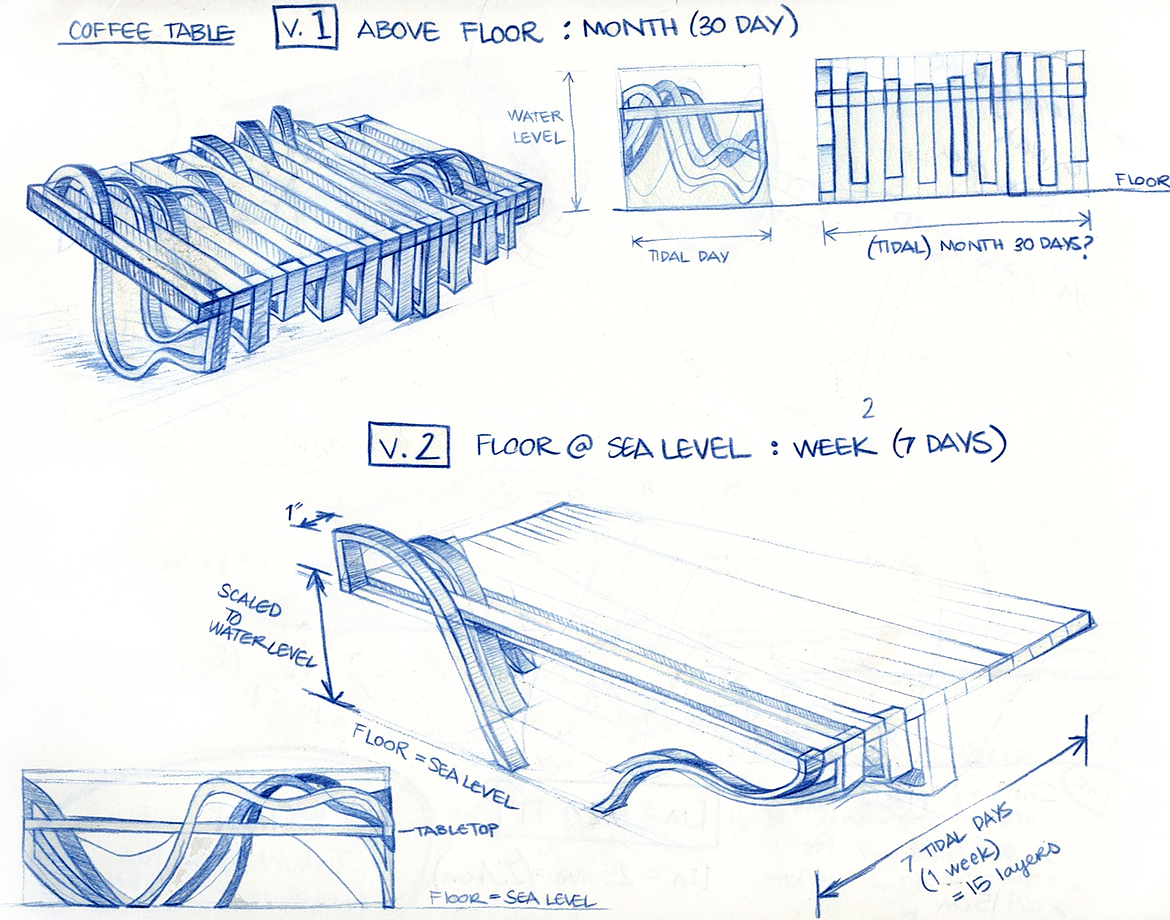
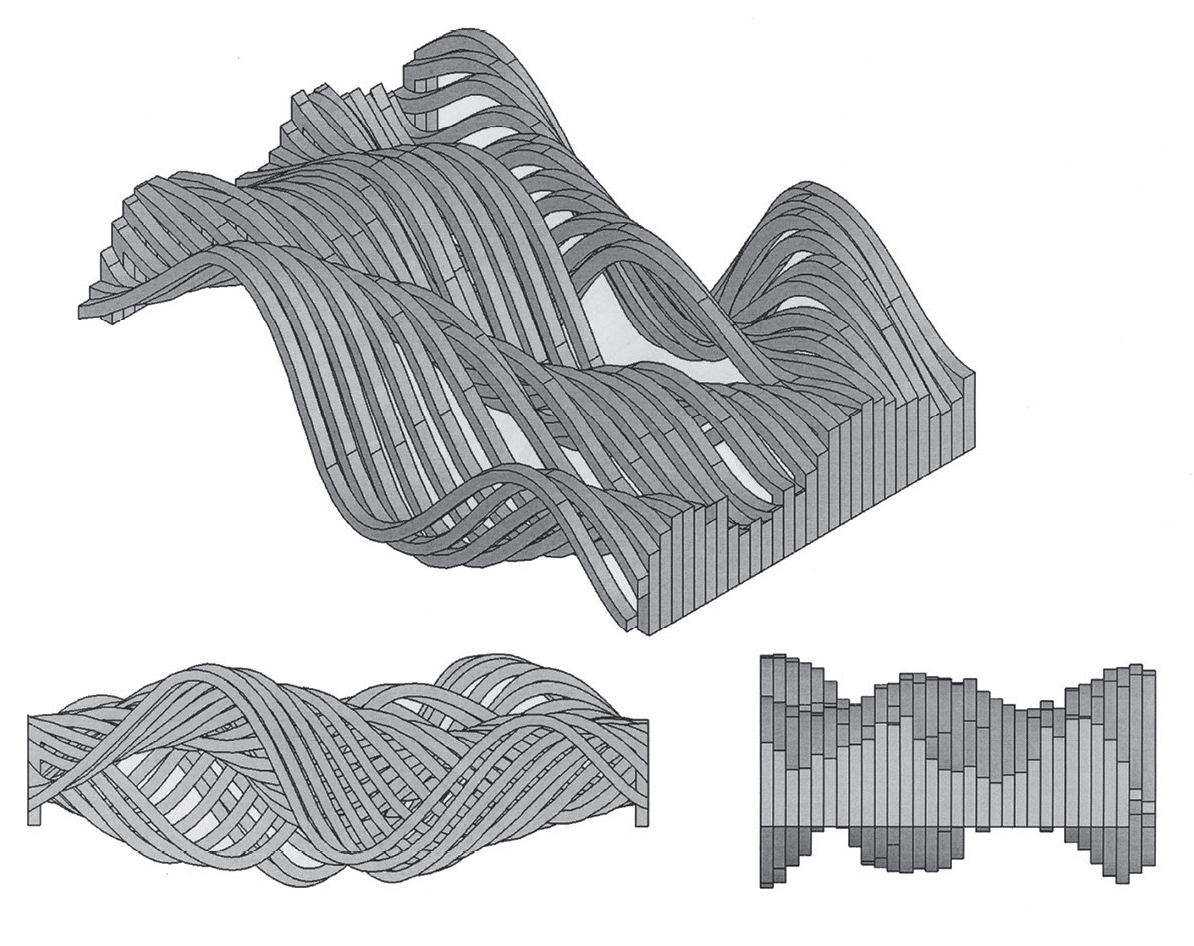
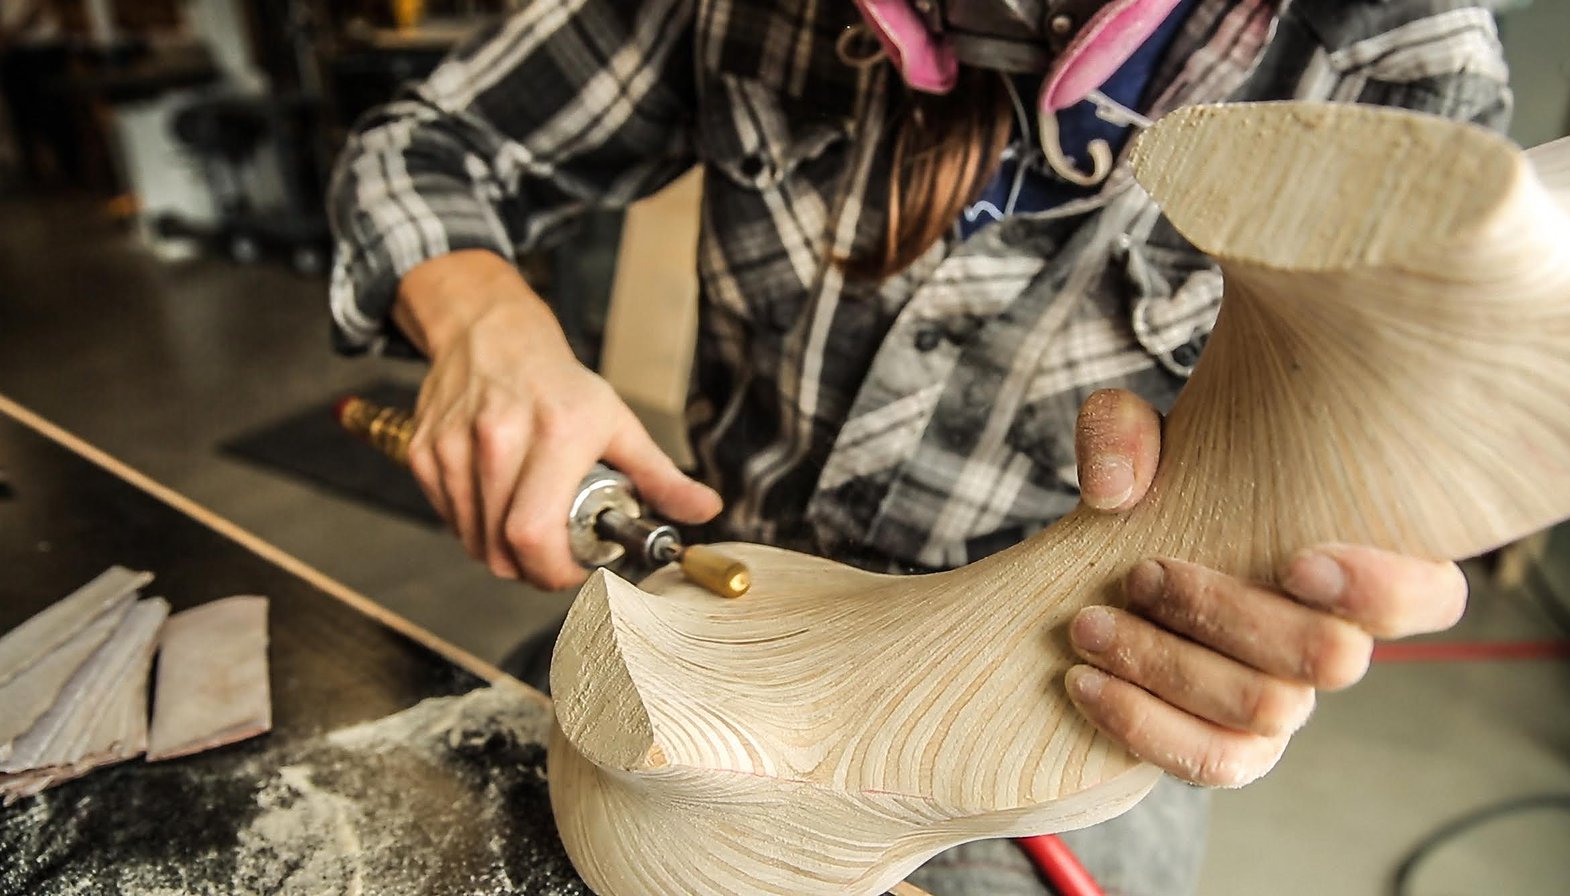
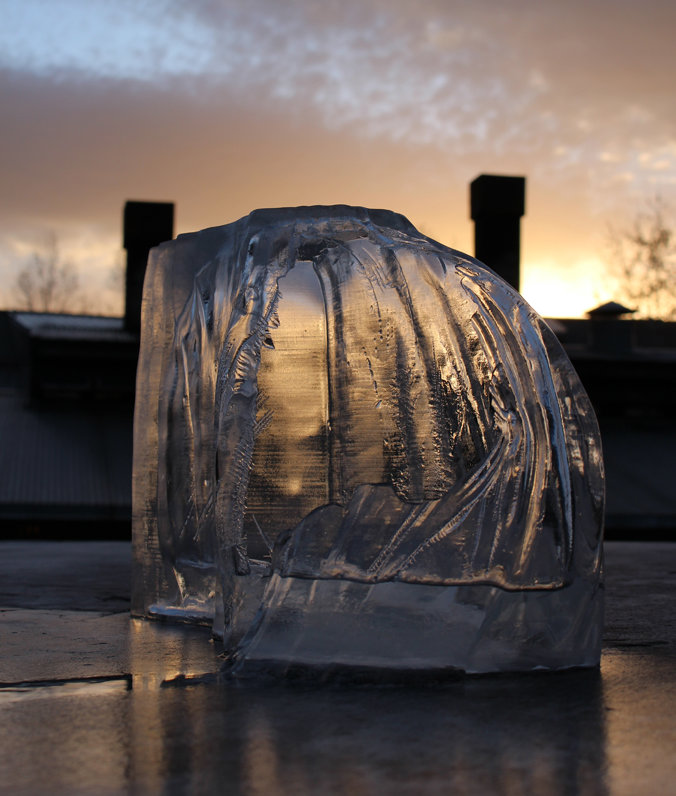
On the show, we talk about some her great artwork, including Tidal Datum, which depicts tidal charts from the National Oceanic and Atmospheric Administration (NOAA), and Grewingk Glacier, an ice sculpture depicting “the shape of the terminus of Grewingk Glacier as it has receded over 150 years time.”
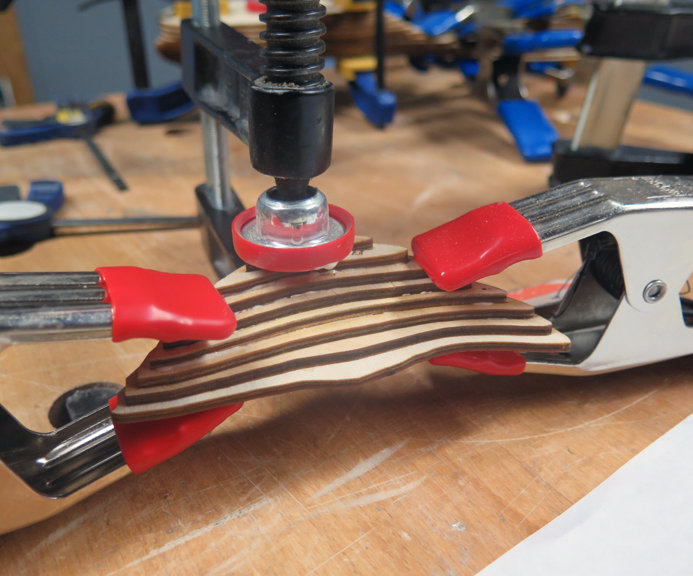
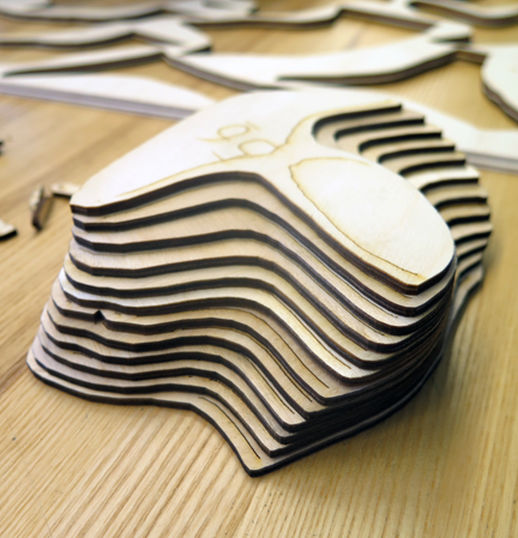
We also talk about the process Adrien follows for her sculpture production, her thinking about work in physical versus digital materials, the boundaries between art and science, and how listeners might experiment with their own data sculptures!
Enjoy the show!


A minor correction to the show: It takes 29 days for the moon to go around the Earth, not the Sun.
Data Stories is brought to you by Qlik. Are you missing out on meaningful relationships hidden in your data? Unlock the whole story with Qlik Sense through personalized visualizations and dynamic dashboards which you can download for free at qlik.de/datastories.
Links
- Adrien Segal
- Adrien’s project Tidal Datum
- Adrien’s project Grewingk Glacier
- NOAA tidal data
- The Sutro Baths
- Rhino for 3D modeling
- Artist Marc Quinn’s Self series
- The DIKW pyramid: data, information, knowledge and wisdom
- Autodesk 123D Catch
- Smell researcher Sissel Tolaas