

On the show this week we have Irene Ros, Jim Vallandingham, and Yannick Assogba from the data visualization team of Bocoup. We talk about how they collaborate with other groups to create open-source data visualization software. We also talk about OpenVis Conference, the successful and innovative visualization event they organize each year, as well as the cool visualization projects they develop internally.
This episode of Data Stories is sponsored by CartoDB. CartoDB is an open, powerful, and intuitive platform for discovering and predicting the key facts underlying the massive location data in our world. Whether you are a business, government agency, or simply a lover of revolutionary spatial insight technology, don’t settle for anything less than the best interactive maps around. Learn how CartoDB is shaping the world of location intelligence at cartodb.com/gallery.
LINKS
Irene Ros
Jim Vallandingham
Yannick Assogba
Voyager (Exploratory Visualization Tool from IDL)
Lyra (Chart Building Tool from IDL)
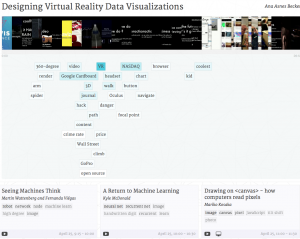
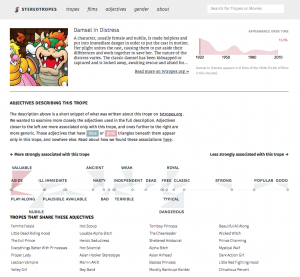
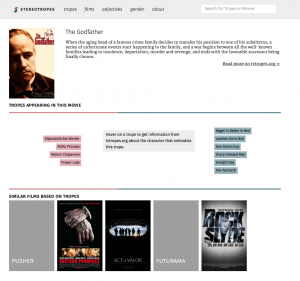
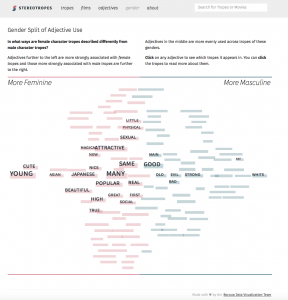
Bocoup’s self-commissioned project “Stereotropes”
Bocoup’s educational initiatives
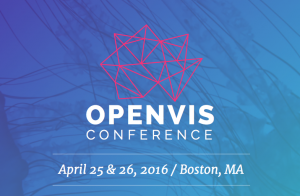
OpenVis Conference 2015
OpenVis Conference Video Archive
OpenVis Conference file of transcripts
Contact the OpenVis Conference team
Lisa Charlotte Rost’s blog posts “One Chart, Twelve Tools” and “One Chart, Twelve Charting Libraries”