
We have Vidya Setlur on the show to talk about the role language, and natural language processing (NLP) play in data visualization and analytics.
Vidya is the director of research at Tableau and has a background in natural language processing and visualization. She is one of the main drivers behind Eviza, a research-based prototype and the corresponding product Ask Data, developed within Tableau to interact with data visualizations through natural language.
She is also the co-author, with Bridget Cogley, of Functional Aesthetics for Data Visualization, a new book on data visualization with a lot of information about semantics and language in data visualization.
In the episode, we talk about the challenges of going from a research prototype to an actual product, research vs. engineering, speech and natural language interfaces, the many ways language plays a role in visualization, the advent of language models, and much more.
Enjoy the show!
Links
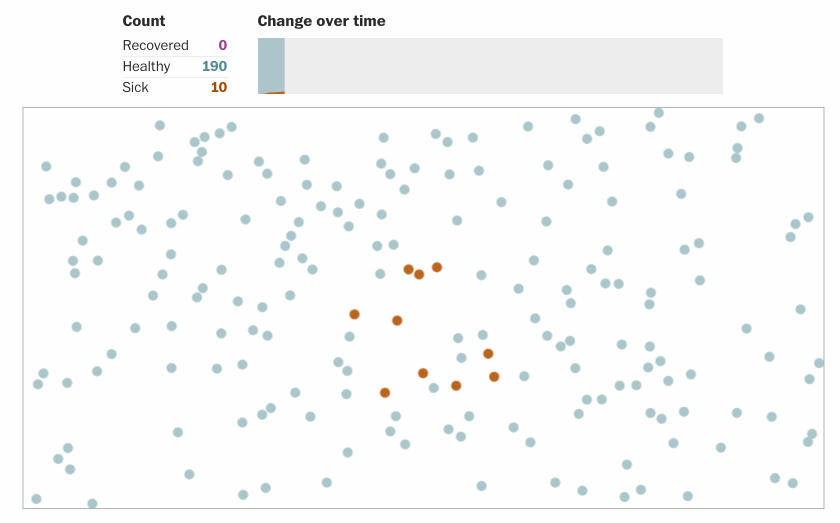
- Winners of Information is Beautiful Awards
- Book: Functional Aesthetics for Data Visualization
- Paper: Automatic Generation of Semantic Icon Encodings for Visualizations
- Paper: A Linguistic Approach to Categorical Color Assignment for Data Visualization
- Eviza: A Natural Language Interface for Visual Analysis
- Paper: Snowy: Recommending Utterances for Conversational Visual Analysis
—
Remember: our podcast is listener-supported. Please consider donating using Patreon or Paypal. Thanks! ?

 Finally, this year we managed to record another classic episode from the IEEE VIS Conference (we recorded a total of 10 with this one!) We have Data Stories’ friend Prof. Tamara Munzner with us to talk about the conference and to highlight a few things she picked from the many events that happened over this week-long event.


 This week, we are joined by