“Different people, working for different institutions, in different countries, at different times, all come up with the same answer …”
– Eric Roston, Bloomberg (talking about global warming)


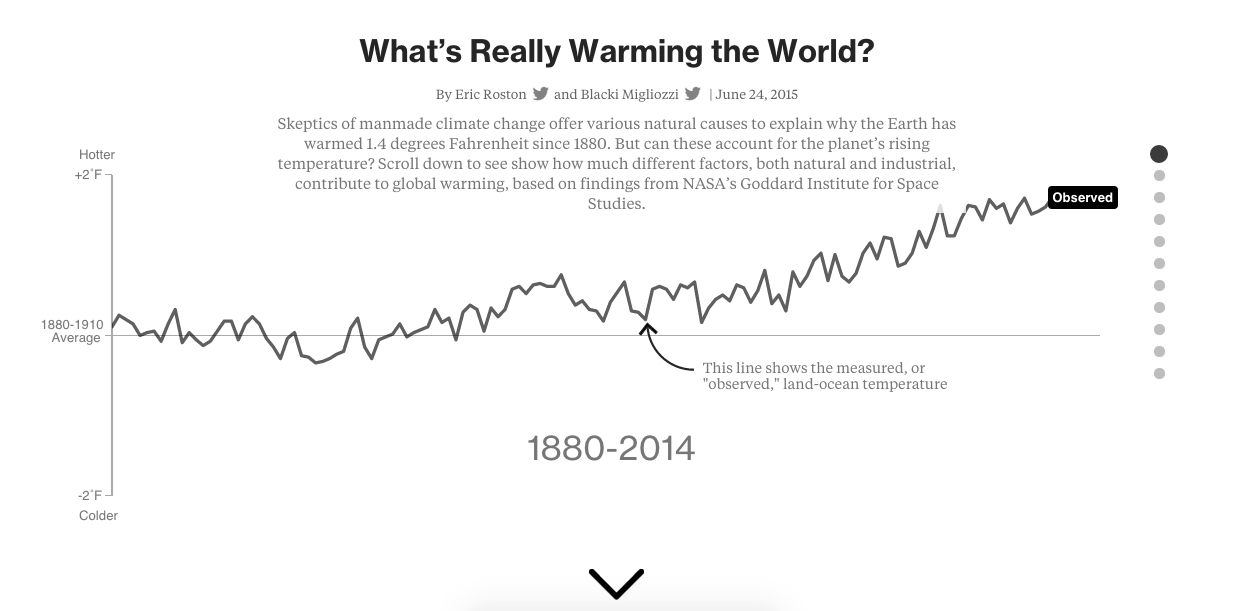
Hi folks! We have Blacki Migliozzi and Eric Roston from Bloomberg on the show to talk about their recent data graphic piece on climate change called “What’s Really Warming The World?”
The graphic shows, through a “scrollytelling,” what factors may influence the world’s temperature according to well-established climate models. It guides you through a series of questions and visuals to all you to see for yourself what correlates (spoiler: carbon emissions) and what does not.
On the show we talk about how the Bloomberg team came up with this piece, their interaction with the NASA Goddard Institute for Space Studies (GISS) scientists who developed the model, and the many challenges of translating important scientific knowledge into more digestible, but not simplistic, articles that everyone can read.
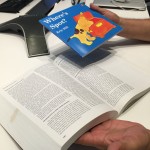
We also talk about how they took inspiration from the children book “Where’s Spot?” (which is a nice narrative technique for vis!) and all the delicate design decisions they had to make.
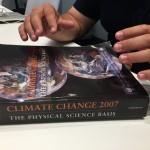
… And don’t miss the moment when Eric drops the huge IPCC (International Panel on Climate Change) report book to give a sense of how big it is!
Enjoy the show!
—
This episode is sponsored by Qlik who allows you to explore hidden relationships within data that lead to insights. Qlik was named a Top 10 Innovative Growth Company by Forbes, and they published an interesting blog post analyzing the data from the ranking. Check it out! Qlik Sense allows you to create personalized visualizations and dynamic dashboards. You can download it for free at: www.qlik.de/datastories.
—
LINKS
- What’s Really Warming the World? – the Bloomberg graphics
- “Where’s Spot?” kids book
- The CIMIP5 Coupled Model Intercomparison Project (61 models from 28 countries evaluated and compared)
- The Intergovernmental Panel on Climate Change (IPCC) (the big tome)
- The IPCC synthesis reports (much shorter and easier to read / so many visuals could be improved!)
- Data on global land and ocean temperature records from NASA
- Scientific article on NASA GISS historical simulations
- Article on how temperature anomalies are calculated
- Datasets from the Bloomberg team: