 [If you enjoy our show, please consider supporting us on Patreon! For the price of one or two lattes per episode, which we publish every two weeks, you can help make sure that Data Stories keeps getting made!]
This week we have Nicky Case on the show to talk about “explorable explanations,” interactive simulations that help people understand complex ideas.
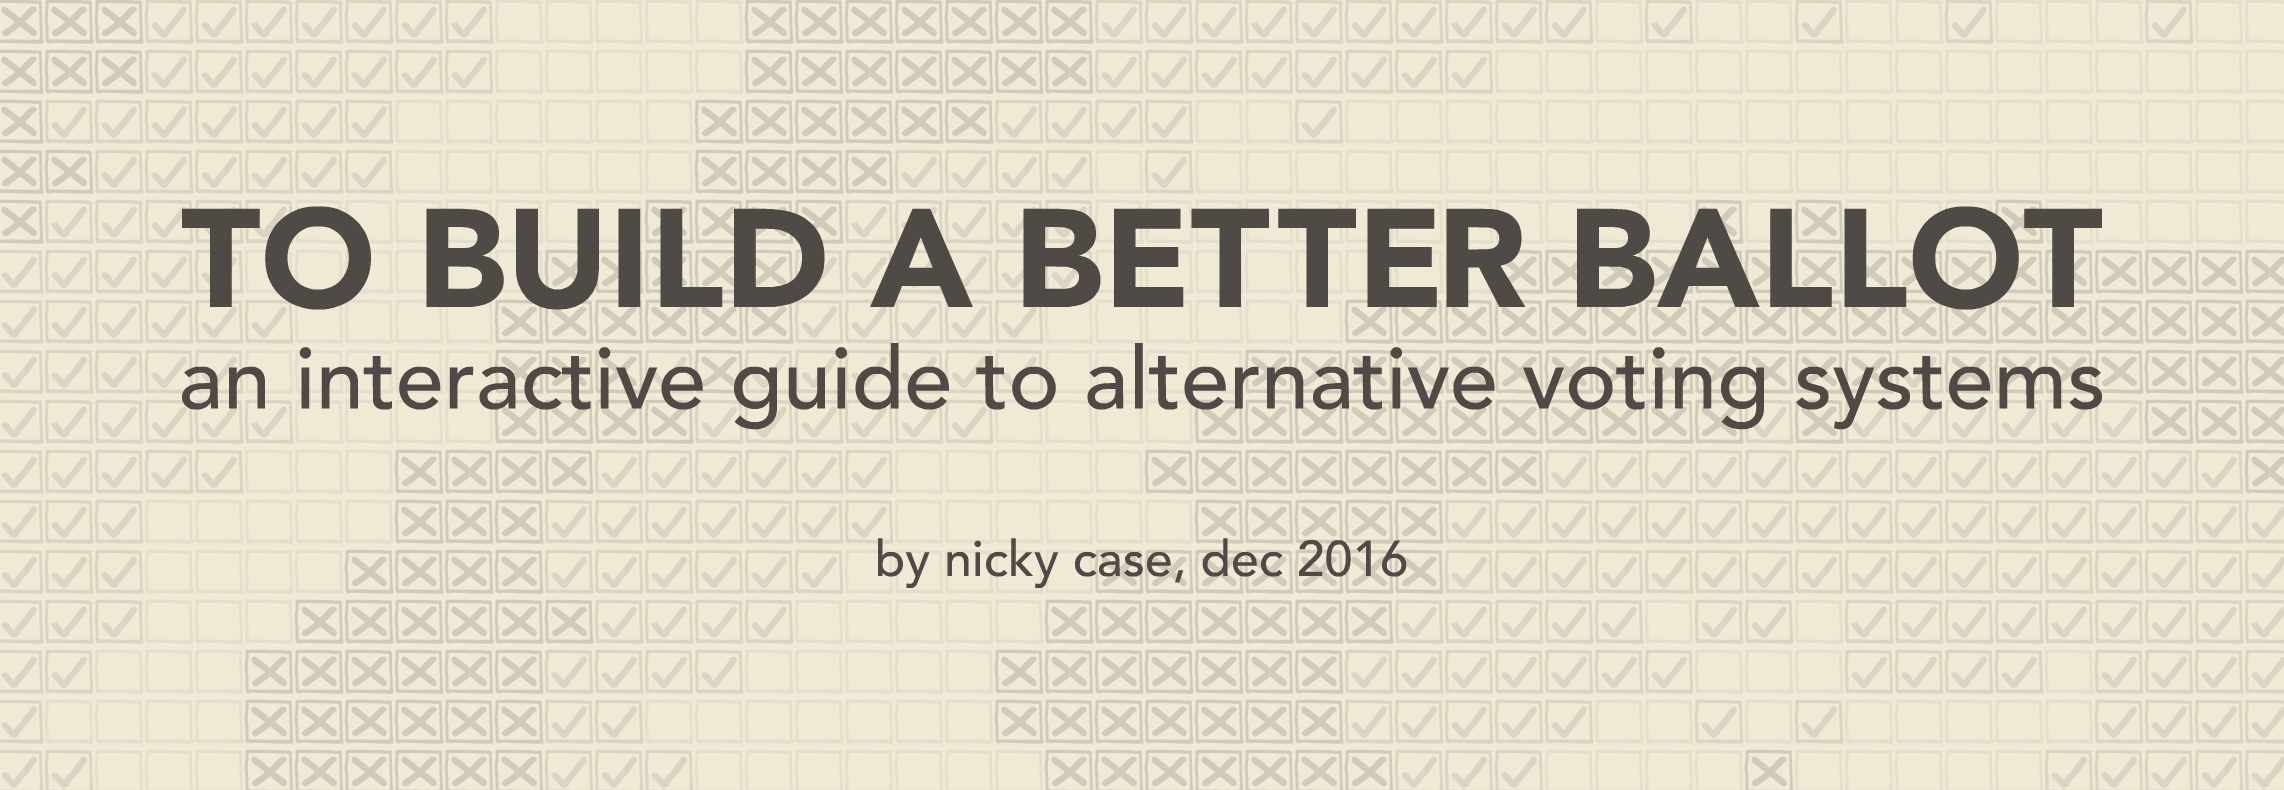
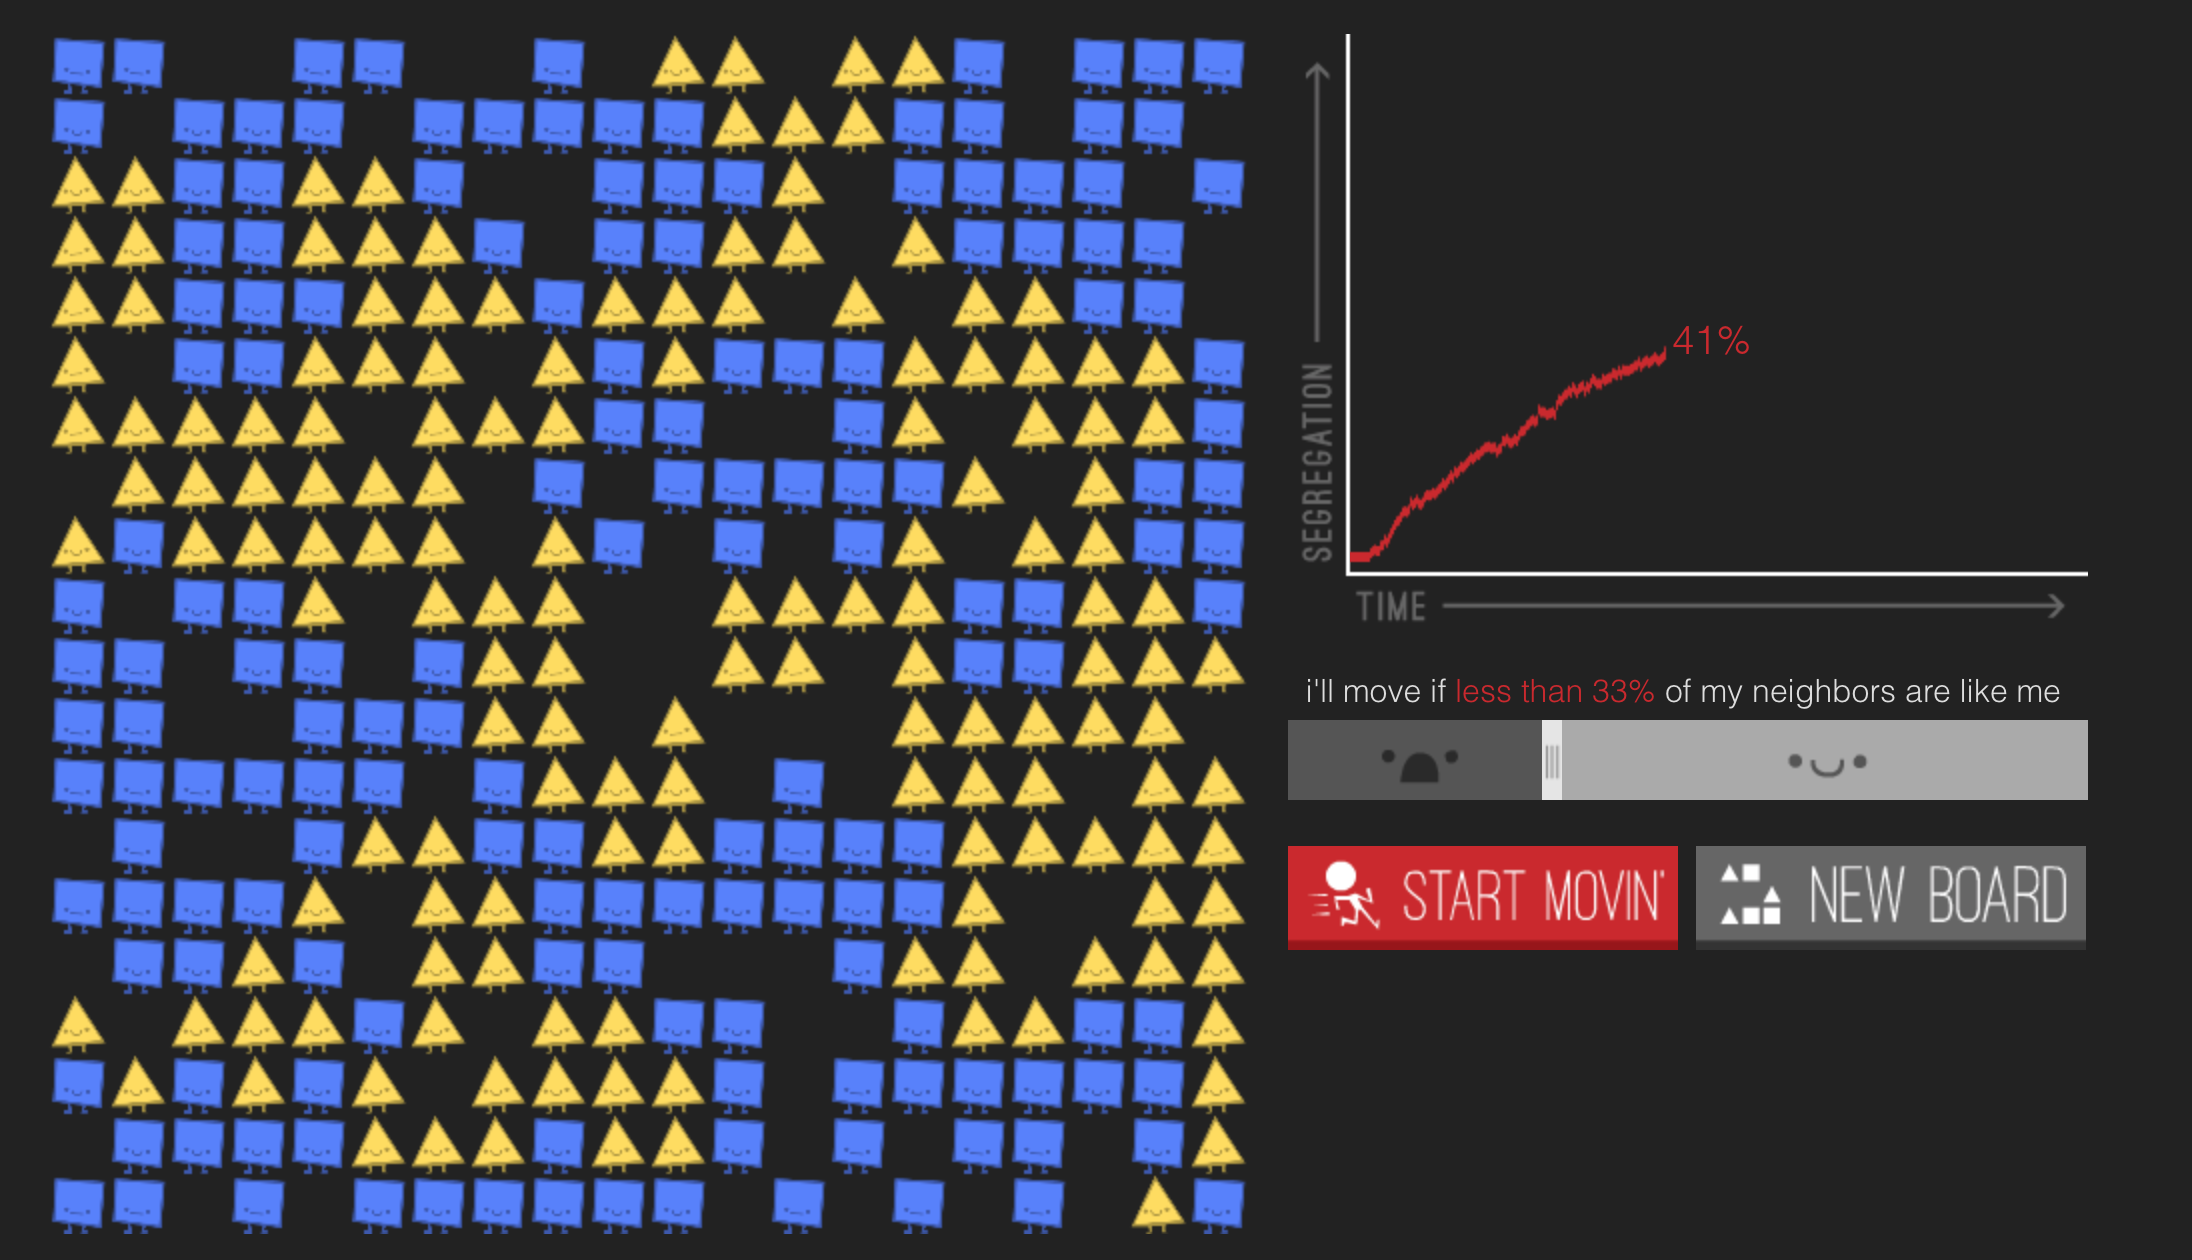
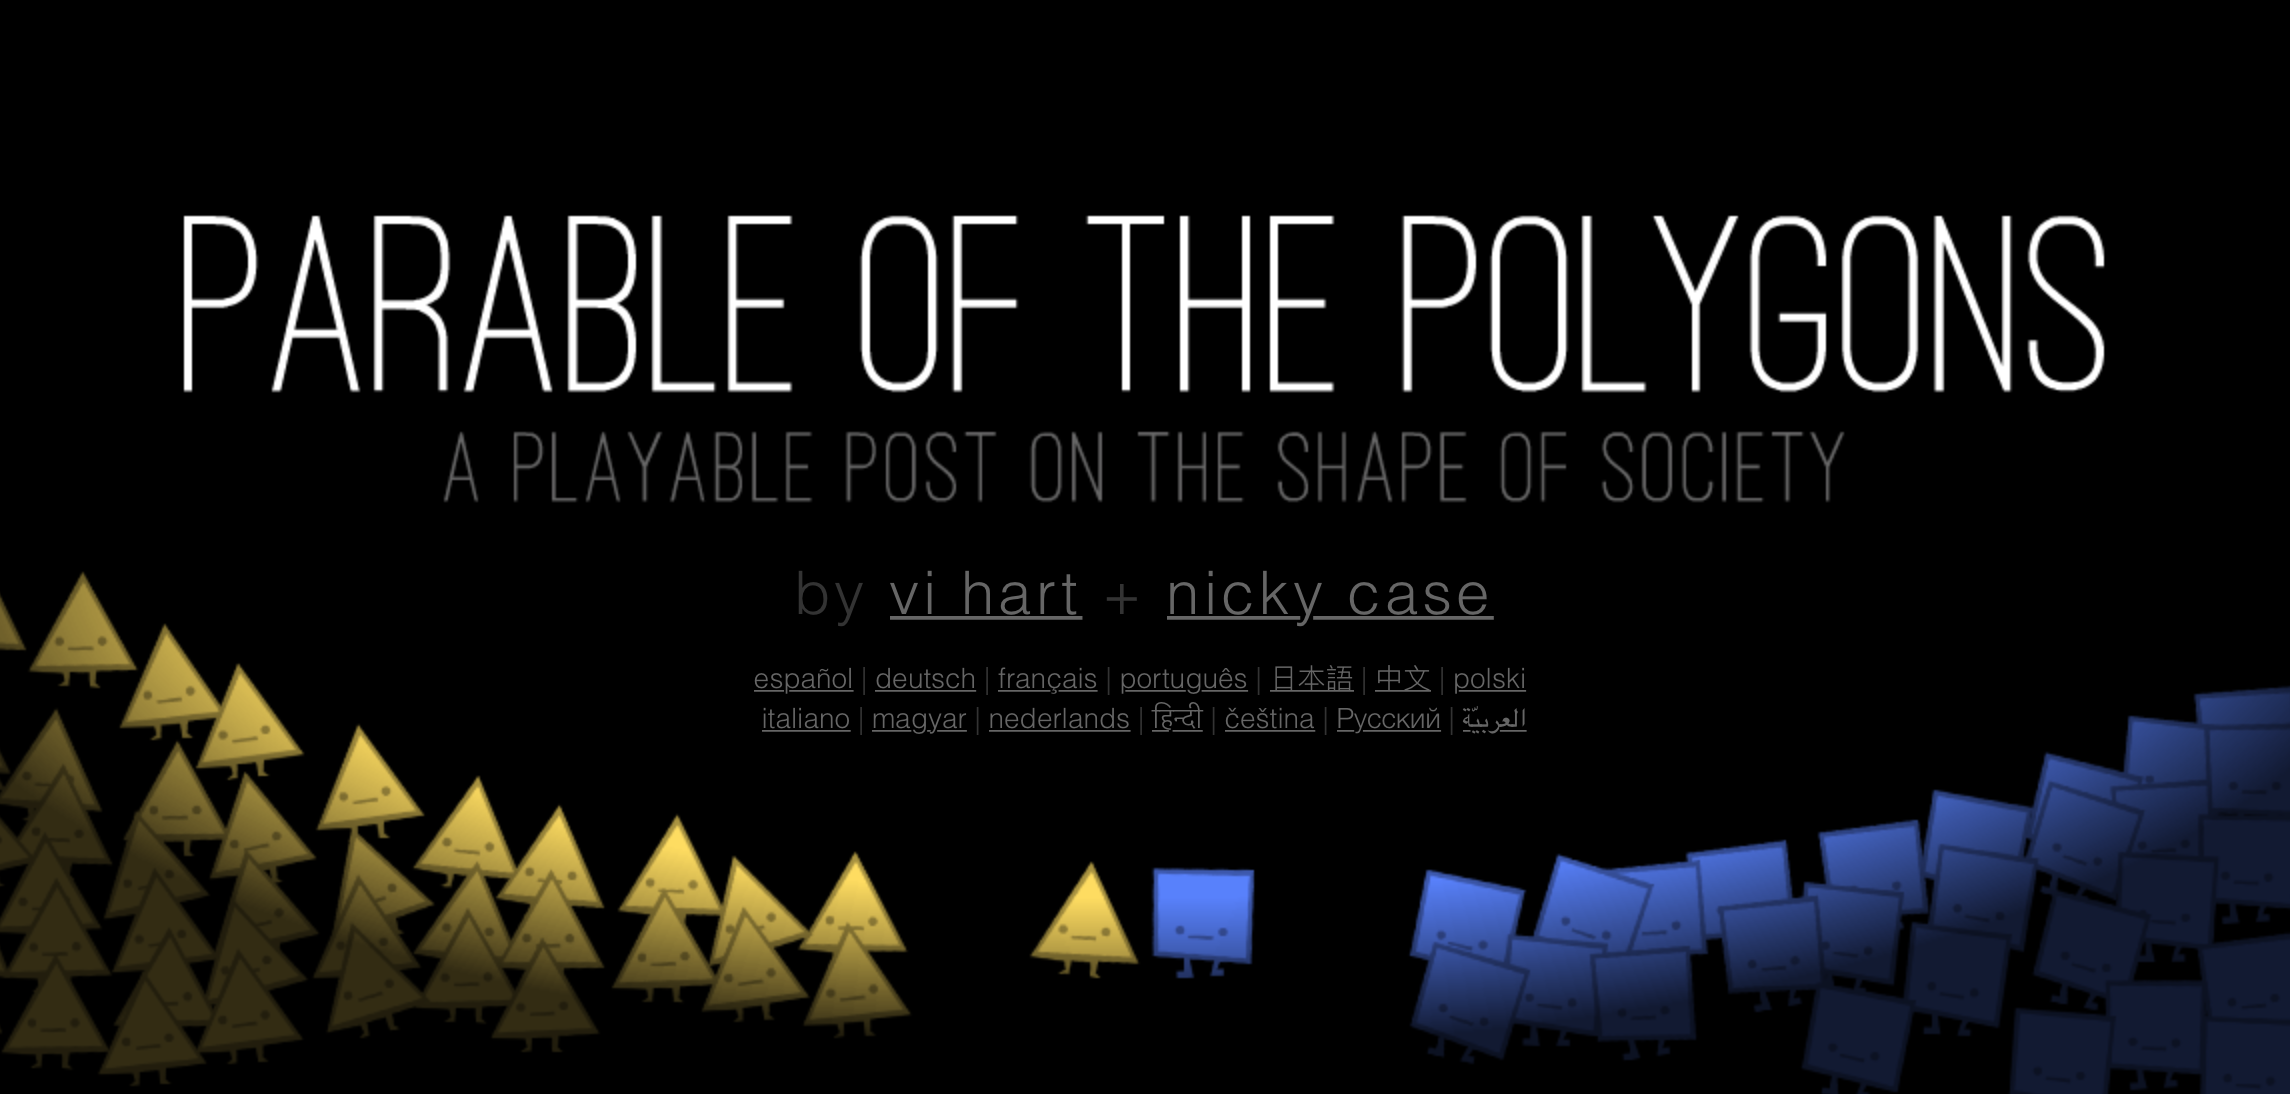
Nicky has developed a whole set of projects over the years, including the popular “Parable Of The Polygons,” which describes how small biases can lead to segregation, and “To Build A Better Ballot,” which demonstrates the impact of various types of voting ballots.
On the show we talk about both of these projects in detail, the definition of explorable explanations, how simulation and interaction might play a role in visualization, and the future of this kind of project.
Enjoy the show!


Data Stories is brought to you by Qlik. Are you missing out on meaningful relationships hidden in your data? Unlock the whole story with Qlik Sense through personalized visualizations and dynamic dashboards which you can download for free at qlik.de/datastories.
Links
- Nicky’s Patreon page
- Project: Parable Of The Polygons
- Project: To Build A Better Ballot
- Nicky’s guide to explorable explanations
- Loopy (a tool to create explorables)
- Collection of explorable explanations
- Github Pages (to create web pages with iframes)
- Moral Machine (explorable on the “trolley problem”)
- Syrian Journey: Choose your own escape route (explorable on Syrian refugees)